
This history is one of our accounts that will probably not be published in the future. However, it does follow the same rules as we list on this website, but we adjusted the starting dollars per stock down to $2,000 from an original $4,000 and we also did some testing of different statistics back in March on a market reversal that did not represent the same methods for about 2 weeks.
We will be following the new trades that have been specifically launched for the purpose of demonstrating our exact algorithms.
Everything below this line is from earlier times.
These charts showing all trades published on a monthly basis.
All July 2019 Trades included in Best 5, Best 10 and Best 15 Groups. Stocks restarted on July 11th 2019
All Jun 2019 Stocks included in Best 5, Best 10 and Best 20 Groups. Stocks restarted on June 17th 2019
All Jun 2019 Pairs included in Best 5, Best 10 and Best 20 Groups.
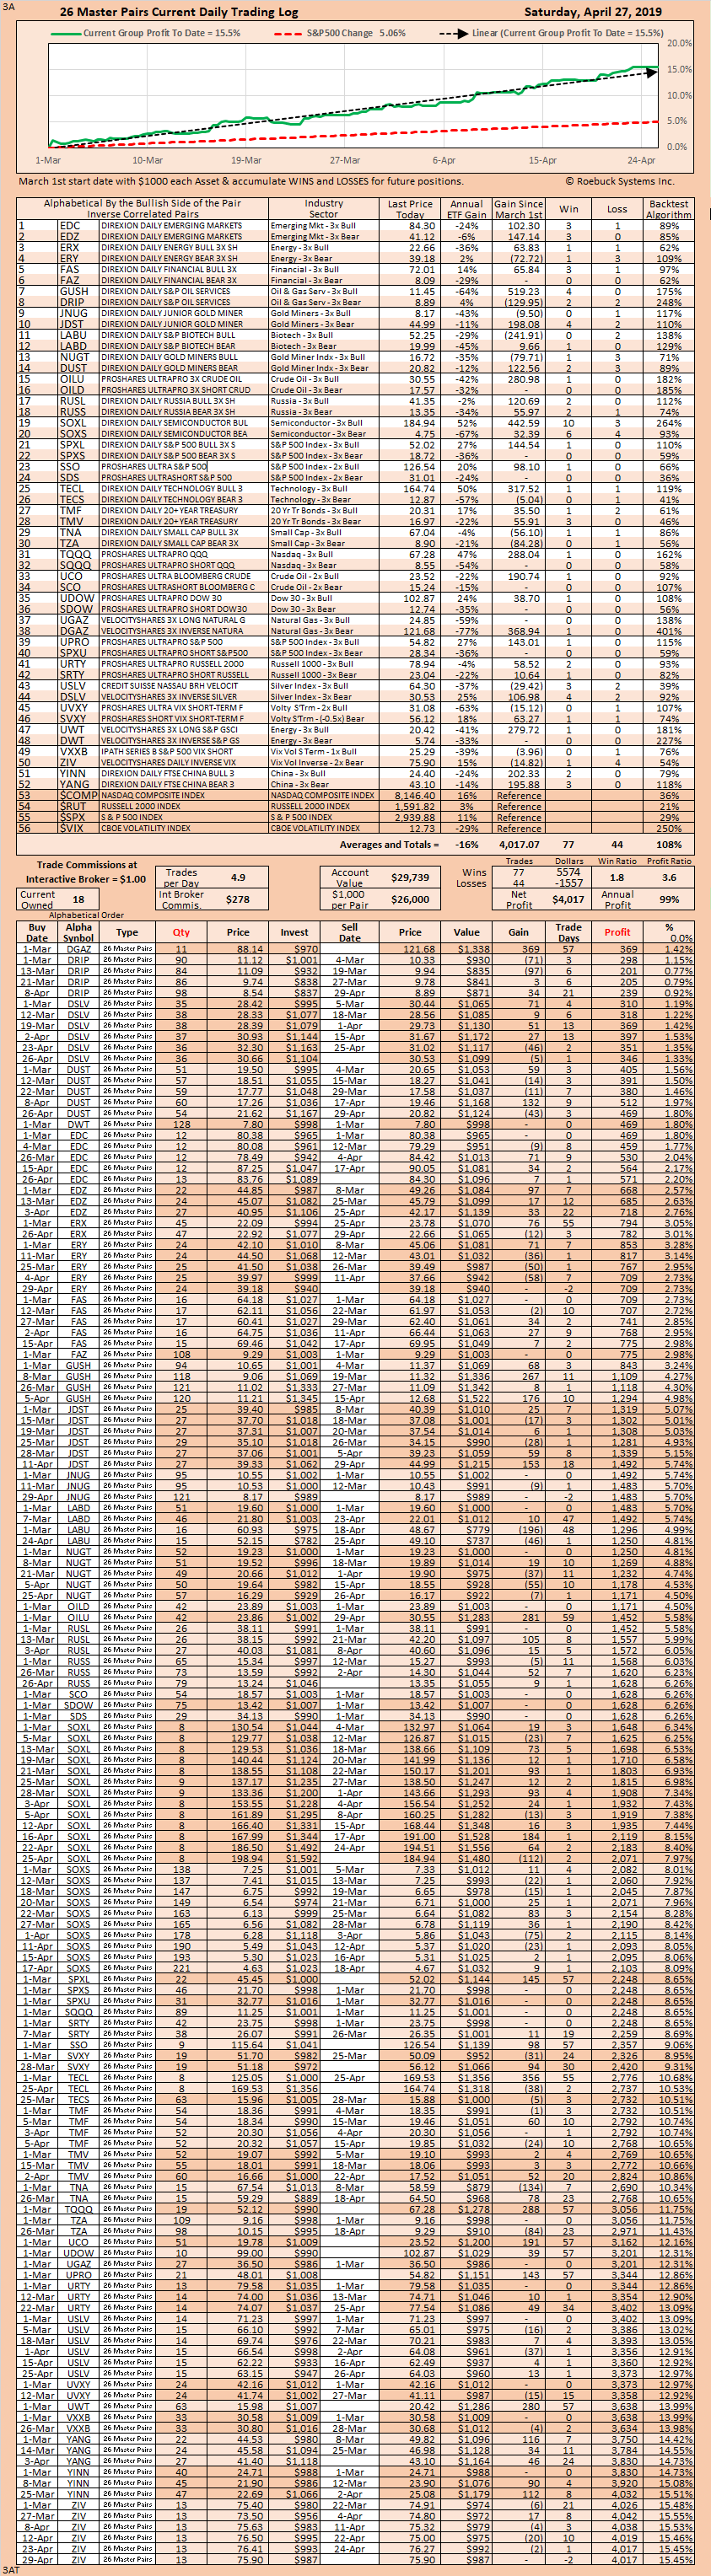
All April 2019 Pairs included in Best 5, Best 10 and Best 20 Groups.
 IM Bull 3x Investment Manager Correlated 3x Leveraged Bullish ETFs |  Mix 10 Bull 3x Mixture of 3x Leveraged Bullish ETFs. |
 Best 5 Stocks/ETFs Best 5 Stocks/ETFs Boosters |  Mixed 10 Pairs 3x Mixture of 3X Leveraged Inversely Correlated ETF Pairs. |
 |  |
 |  |