
Update for Followers for early 2021.
2020 has been a development and investment year for us and 2021 will bring new concepts to our methods of service to interested followers. We will be demonstrating our methods, making it easy to "follow the fund" in a way to minimize the time needed both to follow and to place trades with entirely new concepts.
In the meantime, we strongly recommend all followers to take a serious look at Interactive Brokers where we trade. Their website is more complete than most but offers excellent fills and prices that are well below the market average.
No Buys with Recent High Profitability.
It seems we are in a wait and see mode and should have been on vacation in August.
I am showing the VIX Volatility Index from Aug 4 until Sep 4 and am convinced that it was a good month to do some research.
When markets go up and down every 2 or 3 days, short-term trading becomes more difficult to predict and we would be better off on vacation.
This is what we call the 6 o�clock news volatility and the internet will increase this rapid cycle.
We continue to test a couple of different procedures and will most likely stay with them and maybe a few more during September.
Late Fix on Data Feeds.
We are adding the charts for those wanting daily updates.
September Work in Progress � 1.
We will be testing a new series of 5 ETFs after the Labor Day holiday and will begin this group using only first day buy signals.
We will also use all first day sell signals as usual to maintain the portfolio.
Although we have thoroughly tested longer term use, we want to see how this current increased daily volatility can affect performance.
Followers will recall that we started the last group with 4 ETFs that already had an �own� signal and were not first day buy ETFs.
Another rule that we are using is limiting our �first day buys� to those ETFs showing a recent profit in column 6 of chart 1D. However, �first day sells� will always apply.
Although we have experienced previous short periods of similar volatility, we want to take every opportunity to test different market conditions whenever they occur.
We have special interest in short-term changes because we are geared to make all trades at the next market opening price. This eliminates day-trading or having to watch markets and look for trades all day long.
At the present time, there is just 1 first day buy signal for Tuesday�s open for JDST which is bearish for Gold Miners.
A Work in Progress - 6.
Everything went against us today and especially JNUG and DRIP. Bonds made a strong effort to come back but didn�t quite get there.
First thing we do is look for sells in chart 1D which tells us to keep all 4 positions tomorrow. Unusually there are no first day buys that have shown a profit in the last 8 days. The only one is UDOW which has produced a 3.8% loss, so we will not buy anything at tomorrow�s open.
We have nothing to do but repeat tomorrow with the same 4 positions and rely on a different outcome.
We are seeing a continuation of the day by day volatility that started on August 1 which we do not like.
As previously stated, this is not helpful to our day by day signal production as markets appear to be following the current unusual daily news cycles.
A Work in Progress - 5.
First thing we do is review the signal chart 1D to see how many of our portfolio positions we need to sell.
In this case, we have our full house of 5 ETFs and TZA has a first day sell signal for the open tomorrow morning.
We bought it at this morning�s open for $53.14 per share and normally there will be no difference between any of us, but very small differences can show up.
We assume a value of the last price traded until we get a definite opening price for the sale tomorrow morning but here, we may see significant differences.
We currently have recorded the last price at $53.11 for a loss of 3 cents per share. The reason for that is extended hours trading which continues until 7:00 pm central time but the differences will disappear when we sell at tomorrow�s open.
The loss or profit will change significantly at the open because these 3x leveraged ETFs often change more between the close and the next open than they change from day to day.
Referring back to Chart 1D, there are no first day buys for tomorrow so we will stay with our 4 remaining positions for the day.
A Work in Progress - 4.
Moving on to Tuesday, we had a reversal today from a positive start to a negative close.
In fact, we almost ended with an �outside day� where we beat yesterday�s high and almost beat yesterday�s low.
Bonds made a little money for us today but otherwise we survived the volatility and ended up a little.
Looking at Chart 1D, we have no sells for tomorrow, but we do have 2 first day buys. We will return into DRIP for bearish oil prices and buy TZA for bearish small cap stocks.
This may be a good example of trading both directions during these high volatility periods. We will have 5 positions by retaining JNUG and TMF which are both bullish. We will also retain YANG and buy DRIP and TZA, giving us 3 bearish positions.
However, looking a little deeper, our bullish ETFs are for Gold and Bonds which generally run opposite to a strong market and could easily be tagged as bearish.
Combining them with China, reduced oil prices and small cap stocks suggests that our algorithms are expecting some pain in the Dow. �We�ll see what happens� as someone in Washington keeps saying.
A Work in Progress - 3.
Following up from Friday when we only had 2 days of history, there are no sell signals in chart 1D for our three positions DGAZ, TMF and YANG.
Today was not a profitable one as we ended up with $335.53 in profit which is down from $511.08 on Friday.
There is only one first day buy signal and that is to buy back JNUG at the open tomorrow after we sold it this morning.
We do tend to get a few more surprises when we only have 5 days of history and 2 of those days were non-trading days over a weekend.
With USA having a trade war with China, an important G7 meeting in France and the Amazon jungle on fire, the 6 o�clock news is not the most helpful source of suitable news and can only bring short-term volatility.
Tomorrow we will be bullish on Bonds and Gold Miners and bearish on Natural Gas and China.
As we have often said before, our algorithms are concentrated on what may happen tomorrow based on information today and they will make completely new assessments for the next day after New York markets close tomorrow afternoon.
A Work in Progress - 2.
After showing the almost completed Daily Best chart yesterday, we are showing the results of Friday�s catastrophic drop in the markets.
We would normally have more history to decide what to buy on Monday at the opening. As we only started on Friday, with this group, we will have to wait until Monday evening to replace the 2 sells indicated for Monday morning.
In fact, there may be more sells to replace by Monday evening, but we will continue with this live example and see where it goes. See the sells on chart 1D.
We are also showing our trading chart as it appeared on Friday evening after listing DRIP and JNUG for sale on Monday morning. We use the last price until we know what price they sell for on Monday morning.
There are 22 buys from Friday�s market turmoil for Monday and their performance will guide us what to do for Tuesday. They are not all 1st day buys but they will steadily build our master list of 52 ETFs from the 26 inverse pairs that we currently follow.
As every ETF and every trade builds its individual performance, they each guide us what to buy in the future. We have historically started new groups quite often, but August 1 was our worst start date, but it fortunately coincided with a much different selection basis with improved potential.
We will continue to demonstrate the process in detail on the Blog before making it generally available to subscribers.
A Work in Progress.
Today we tried out our new Daily Best chart and assumed we started a new group this morning with the same ETFs that we owned yesterday.
It worked out and we are adding the chart for your interest.
First Day Buy and Sell Signals are Key.
Some of this very recent short-term volatility has thrown us behind a little but we confirm the importance of the signals on the first day they appear.
These first day signals have always had a significant benefit going back to the early days and the affect is to slow down the entry into a portfolio of ETFs.
We are attaching an example of how a portfolio of 10 ETFs can be constructed but the same principal can be applied to any quantity of ETFs.
We recommend 5 ETFs as the minimum and up to 10 ETFs as alternatives.
Note this is an example not to be followed and represents 41 days of performance and the percentages will generally flatten out as the number of days of history increases.
You will also notice that the last couple of weeks of up and down daily volatility has tended to repeat unusual cycles of lower signals and push them further down the profit column.
Another statistic of interest is the average holding period dropped by 2 days down to 6, confirming further evidence of the indecision in this volatile market.
We are not currently publishing daily charts of this process until we have completed the process.
Wrong Timing for Changes.
It became clear today that starting with our new groups on August 1 has been the single worst decision in over three years.
Our algorithms have hardly changed in the same three-year period but the start dates for new groups of ETFs have been randomly based on new group design and application to leveraged ETFs.
We finally hit a wall on August 1 and the reason was 3 days of down markets, followed by this volatile display of up to 800 Dow points in opposing patterns of extraordinary news items.
The result is we need a restart for our newest and potentially highest performing groups.
We would rather delay the start, even though we had been using these improvements during previous months because one of our primary goals is to avoid day-trading that needs live management.
All our work to date has been toward trading at the next day�s opening price to avoid day-long market watching.
This last couple of weeks has seen extreme spreads from the market close to the following opening which are not conducive to starting a new set of groups by us.
We will continue updating the website and Blog as before but anticipate making the changes to the Best 5 and Best 10 groups.
Changing the Numbers.
A few times recently, I have referred to the minimum number of leveraged ETFs that should be owned or followed from our groups.
I decided to change the numbers.
Five (5) has been our minimum number of ETFs to own or follow for about 3 years now and 5 is my minimum. However, I would not argue with anyone who likes seven (7) as their minimum.
Ten (10) has been the next quantity that we have in our groups, but I indicated a preference for eleven (11), and I don�t have a good explanation for it.
Somewhere in the past, I came to believe that a maximum of 11 items or projects represented the most efficient use of one individual to follow.
In the past, I was involved with the tooling for foreign dealerships of the Ford Motor Company and I know that Ford had statistics on subjects such as �how much overtime was most efficient� and �how many weeks� before it became inefficient�.
This sounds very much like Corporate thinking but perhaps it was useful, and I think it may be where my eleven (11) came from. Nevertheless, I have rounded it down to 10 because it rhymes with 5, but I have eliminated 15 because it is too many.
We are still limited to 26 of the 100% inversely correlated ETF pairs because there aren�t any more of them for us to use. With the growing interest and volumes of ETFs, I expect more than 26 in the future.
Charts Updated � No Blog Tonight.
See a sample chart.
Best 5 Buys UP 22% Since July 11.
We have experienced the Yo-Yo affect these past few days but the basis of our algorithms and signals showed success.
The average of all 3 groups is up 16% as seen in the daily chart above and the annual return is up 168% in 34 days.
All these trades will be published on the Historical Data page as usual at the end of the month and we expect to be offering this new program by then.
Our mathematically based rapid-entry and exit algorithms together with trading 100% inversely leveraged ETFs in both market directions has worked well.
This method worked positively in the past bullish markets but lately, we also see the benefits of eliminating direction from the investment process and over extreme volatility.
Putting Money to Work � A% or B%.
We have been collecting data for a long time and perhaps the most important data is �recent percentage of profit�.
If you are a Bond investor, next week won�t make much difference to your results but leveraged ETF investors must decide very quickly.
With ETFs, there are variables to consider such as management cost, leverage, trends and expectations.
Due to our rapid entry and exit algorithms, we find the best measure of where to invest is �What have you done for me lately�?
Along with our algorithms, we have a marketplace of 100% inverse pairs of ETFs which provide profit in both market directions. These profit opportunities are available every minute of every day, but you must have guidelines to apply the algorithms to the chosen market.
A point of note here is the delay time between the algorithm signal and the investment. Few people can watch the markets all day. For us, the time of most data input is 4:00 PM in New York when markets close and the most convenient time to apply the signals is 17.5 hours later when markets open again.
Market watchers may look for additional gains by watching futures and market statistics at the open, but it needs other levels of knowledge and is not critical.
Another decision we suggest is to spread the risk into at least 5 ETFs just like any other investment portfolio. I don�t recall where I heard this next rule but a maximum of 11 assets appeals to my thinking.
See a sample chart.
Finally, we have A% or B%. This is the simplest of rules but needs the most attention.
A% means you will invest the same amount of capital in each position to balance the risk and volatility.
B% means you will invest different amounts of capital in each investment depending on a perceived benefit and here we must return to all that data we collect.
There is no single answer to the length of trends, and we have specifically chosen these Inverse pairs of ETFs to eliminate the need to know which direction.
However, we find that the odds give an extra degree of profitability by following �recent percentage of profit� but perhaps, there is a better way!
Leveraged ETF Pairs.
Put and Call contracts rely on a series of future values called strike prices together with a series of expiration dates to produce contracts based on various underlying assets.
Call contracts generally set a series of future contracts above the underlying asset value to profit from increasing values and Put contracts generally set a series of future contracts below the underlying asset value to profit from decreasing values.
Leveraged inverse ETF pairs are more convenient for investing in direction.
Options were introduced hundreds of years ago in a London Coffee House, mostly as insurance on ship�s cargoes, due to the considerable risk of getting to a destination on time.
The first ETF (Exchange Traded Fund), started in 1993 to replicate the S&P 500 Index under the symbol SPY.
By 2006, companies were devising ETFs for many underlying assets and rapid growth followed as they were conveniently traded on stock markets and had lower management fees than Mutual Funds.
Next came leveraged ETFs using debt and derivatives to offer daily re-balanced contracts with fixed performance leverage of 2x, 3x and 4x.
These include 100% Inversely Correlated Leveraged ETF Pairs.
Each 100% inverse leveraged pair has a bullish side for upside investing and a bearish side for downside investing and an equal but opposite gain and loss occurs every day.
Our algorithms recalculate signals daily to determine which direction is likely tomorrow.
Algorithms together with these inverse pairs eliminate direction and keep us invested 365-days each year.
Numbers Tell the Story a Different Way.
As you know, we follow 26 inversely correlated pairs of ETFs. That means 26 ETFs go up and 26 ETFs go down every day by about the same percentage because each side of the pairs relates to the same underlying asset.
It can�t be exact due to all those options with higher volatility that are used to create the leverage. These play a large part in the ETF evaluation plus the wider bid/ask spreads that are present whenever options are used.
Here we show the relationship between the bullish and bearish sides of ETFs.
We added together the opening price of all 52 ETFs on July 11 for a total of $2,416.04 and then added the opening price on August 8 for the same ETFs with a total of $2.474.27. For comparison the difference is a positive 2.4%.
Note that the high maintenance cost for this calculation is eliminated because the bullish and bearish sides both have equal cost.
The differences between the S&P 500 for the same dates was a negative 3.4% but the VIX Volatility Index was a positive difference of 48.8%.
The ETF difference can be explained by a much higher volatility index which substantially increases the prices of the options used to create the high leverage of all 52 ETFs.
But here are the numbers that are affected most by our algorithms.
The split at the halfway mark on our 1B Charts serves the following purpose. If you accumulate the �Best Profit� for the top 26 ETFs, you have a total of 382% and then compare it with the bottom 26 ETFs, you get a negative 290%.
The important result for our algorithms is the ratio between the 2 halves which normally had a nominal 2.4% price difference between the bullish and bearish sides of these 26 ETF pairs.
Our algorithms produced a difference between the 2 halves of 382% - 290% = 92% which is a 32% positive difference in 29 days since July 11.
Charts Updated - No Blog Tonight.
On the road today but here is a preview of part of our new program.
See a sample chart.
An Interesting Question Today.
As we accumulate more data on these leveraged ETFs, we will be announcing more rewarding groups. This is the main reason for our short Subscriber hiatus.
The question basically asked if we could take a second buy on appropriate ETFs.
Many of our followers are now used to seeing the current performance data on various charts and we will be taking advantage of that information.
However, our concentration is on rapid entry and exit signals and we are quite prepared to sell within 1-day as indicated in yesterday�s Blog.
We are prepared to make a quick decision to get in and out of an investment, rather than slow down our signals in order to buy and hold any or all leveraged ETF positions.
We find many reasons not to hold on to these trades because of their high volatility risk and their high daily management costs.
Our signals have shown much better performance when getting in and out of leveraged ETF positions rather than staying with none-leveraged versions of the same underlying sector or index.
Our concentration on �speed of decision� has overwhelmed a decision to �buy and hold� longer trades. The fact that we may have bought and sold a couple of times in the same trend has proven more advantageous than holding longer trades.
This is precisely the tiger that we have tamed and current and historical charts with our pre-published trades on the Historical Data page confirm that decision.
A reminder that I love my accounts with Interactive Broker at $1.00 per trade and Tradier at $3.49 per trade. I like saving money.
Are 1-Day Trades Mistakes or Not?
You would think that buying one day and selling the next would indicate that something went wrong but maybe not.
We looked at all 3 current groups that have now run for the last 25 days and reviewed all of them for the wins or losses.
The commission at Interactive Brokers for these completed trades was $2 per round trade and has already been removed from the profit.
With a total of 23 round trades for this period we lost about $8 total for each trade. This seems to vary up and down.
Last time we looked, this same check indicated a $5.40 profit for each 1-day trade, and it seems to balance out close to zero over longer periods.
We are constantly looking for ways to improve our algorithms and historically these 1-day trades have been within about $10 either way, based on our standard $1,000 original investments.
Some weeks ago, we reported on our longest recent trade that lasted 116 days and made a profit of 94%. These are the same algorithms that stay in long-term profits but will get out of these 1-day trades.
One of our favorite comments has been the rapid entry and exit capability of the algorithms which works so well with high volatility leveraged ETFs as well as stocks.
Charts Updated - No Blog Tonight.
Investing in Exchange Traded Funds.
Regular non-leveraged ETFs are well worth considering in place of Mutual Funds because they have much lower management costs.
The ETF industry began with the symbol �SPY� in 1993 and is the largest ETF in the world. It represents and mirrors the S&P 500 stock index.
With assets close to 300 Billion and an expense ratio of about 0.09%, it has a bid/ask spread ratio close to zero and a dividend yield of about 1.8%.
The past 15 years have seen rapid ETF growth competing with Mutual Funds.
ETFs are traded on stock exchanges the same as stocks and represent all types of stock indexes, stock sectors, volatility, commodities, bonds and currencies and others.
More recent growth has come from leveraged ETFs that use Option Contracts to double, triple and even quadruple their daily relative price movement.
These are re-balanced every day before markets open by adding Put or Call Options to establish and maintain the daily published leverage. These are depicted as having 2x, 3x and 4x the leverage of the underlying assets or sectors.
Leveraged ETFs are not produced for long or medium-term investing because the daily management cost is high. However, they are extremely useful to professional managers for hedging portfolios and taking advantage of short-term trending situations.
One of the latest varieties of these funds are the inversely correlated pairs of ETFs. Much like Put and Call Option Contracts, they offer a pair of funds that move in opposite directions, based on the movement of the underlying asset. By timely switching from one side of the pair to the other side, profits (or losses) can be made in both directions.
Option contracts are also used to create these ETF pairs and their producers incur the same daily re-balancing costs as leverage is increased.
Entry and exit points with short-term trades are necessary to overcome these daily management costs and that is what Roebuck Systems algorithms are designed to do.
Markets Down - We Bounced Back.
No Blog today but a good day to see how we trade in both directions.
Rules for Following the New Chart 1B.
Let�s look at an easy way to follow the �Best 5 Buys� group from start to finish but before we start, we were hoping to begin our Subscriber base again this coming first weekend in August but we may need another week or so . Thanks for your patience.
See Sample Chart.
First, we have no financial connection but currently use and recommend Interactive Brokers (Online Sophisticated) at $1.00 per trade and Tradier Brokers (Online Simple) at $3.49 per trade. (Tradier offers $200 or 60-Days of Free Trades using code �ROEBUCK200�.
We also prefer minimums of $1,000 for each ETF and a minimum of 5 ETF�s.
For the purpose of explanation, let�s assume you will maintain 5 assets each day and $1,000 for each ETF.
We will use the attached Chart 1B for this example even though these results were generated just in the last 15 days.
In this case you would buy the 5 ETF symbols in column 3 with the Best Profit in column 7 and a Buy signal in column 1. Namely, you would buy DGAZ, DRIP, SOXL, NUGT and OILD.
Next, divide your starting $1,000 per ETF by the Last Price in column 4 and round-down the Buy quantity for each ETF you will be buying.
Always place all Buy and Sell orders with your Broker at the market opening price for the next trading day. This is all you do on the first day you begin following our algorithms.
Let�s now suppose that tomorrow night, you receive a new 1B Chart.
The first thing to do is make a record of the value of your current 5 ETFs and divide that total value by 5 to give you the new investment value for each new replacement ETF if needed.
Next, sell all current ETFs that have a new Sell signal in column 1. You also need to sell any of your current ETFs that have a Buy signal in column 1 but are no longer in the new top 5 positions.
Finally, you need to buy any ETFs in the new top 5 positions from Chart 1B. The quantity of �buys� should equal the quantity of �sells� in order to maintain your portfolio quantity.
Unless you have excess cash available in your account, you will need to deal with the �Banking 2-Day Rule�, which takes 2 days before cash from sales is available for new trades.
The first solution is to convert your Cash account into a Margin account. This makes inexpensive credit available to cover the 2-Day Banking Rule and will solve most of your needs. Due to current Margin Rules, you may sometimes not have enough margin credit to cover purchases. You may then make a partial purchase of the least profitable signal or wait until cash is available to complete and re-balance the trades as indicated.
The other solution is less desirable, but you could leave excess cash in your account which will be earning zero profit.
Each day you will own a different value of each ETF due to their daily price changes and sometimes you will be tempted to Buy or Sell a few shares to make up for significant changes. I would avoid these changes until you have more experience with the process.
You will be selling on the first day of Sell signals but buying will mostly occur at some point during a trend.
Remember also that 50% of these ETFs are bullish and make money during an uptrend while the other 50% make money during downtrends. This makes it possible to trade 365 days each year, no matter the general direction of markets.
Inverse Pairs YES - but Very Different.
100% Inversely Correlated and Highly Leveraged Pairs of Exchange Traded Funds and Notes.
Quite a lengthy name for an asset with long-term losses and short-term fear and danger.
Better known as �ETF Pairs”, the benefits are more visible for the non-leveraged versions due to their management costs being less than mutual funds.
Not so for leveraged ETFs! You need speed and greed for the leveraged versions and here�s why.
Every morning when markets open for business, the Managers of 3x leveraged ETFs have finished manipulating their assets by using highly leveraged Option Contracts to provide the advertised leverage at the 9:30 am New York market opening.
As soon as trading begins for the day, that leverage changes up or down but one trading day later, more Option Contracts will be applied to re-balance the ETF back to its advertised leverage for the next day�s traders.
Unfortunately, these options all have one thing in common and that is Time-Value. Time-Value loses value every day. These options are all worth nothing at their expiration date and therefore our leveraged ETFs are losing value every day.
You need SPEED as provided by our algorithms with average 10-day trades.
You need GREED as provided by our selections of 3x leveraged ETFs.
And, you finally need DIRECTION as provided by our algorithms selecting the bullish or bearish side of these leveraged ETF Pairs.
You can now trade 365-days each year, with speed and with greed, knowing that direction is being handled by our algorithms along with the best selection of: -
�100% Inversely Correlated and Highly Leveraged Pairs of Exchange Traded Funds and Notes�.
Some Not-So-Obvious Advantages.
Please know that we follow the exact same system that we publish for Subscribers and Blog Followers.
However, there are some features and information that we have incorporated into these new algorithmic methods and charts that give certain useful info.
For example, if you look at subscriber chart 1B on the �How to Follow� page, note that the top performer on Friday, July 26 was the Bearish DGAZ.
Now look at the worst performer at the bottom of the same chart to see the Bullish UGAZ. Useful information!
On July 25, just past the middle of that day�s Blog, I was explaining how we held the Bear DGAZ for 116 days for 94% current profit or an annualized gain of 288%.
That was an unusual length of time to hold a leveraged ETF (Exchange Traded Fund) but our same algorithms that have average trade lengths of less than 10 days, also held DGAZ for 116 days.
As you know from the symbols, the bullish UGAZ (Up Gas) and the bearish DGAZ (Down Gas), are a perfect 3x leveraged pair of ETFs that represent the daily fluctuation in the price of Natural Gas.
Gas is typical of single asset ETFs. Others, such as Gold, Silver and Semiconductors can also have longer single-direction trends that reflect world-wide conditions as opposed to Stock Indexes that have a range of trends within a single ETF.
While looking at Subscriber Chart 1B, you can see how easy it is to follow our algorithmic signals.
1 � Decide on �Your Quantity� of ETFs to maintain every day in �Your Portfolio�.
2 � Daily, calculate current �Average Value� of ETFs held, or decide on a new value.
3 � Daily, sell all ETFs with �Sell Signals�.
4 � Daily, sell �Buy Signals� for ETFs no longer in your �Replacement Portfolio�.
5 � Daily, buy replacement ETFs from top of �Best Profit List�, using new average value.
Ready Soon and Ahead of Schedule.
We have 2 weeks of good anticipated results and are almost ready to go.
See Sample Chart.
I am showing the new subscriber chart which may be subject to minor changes.
The first thing to do is look at column 1 and sell everything with a sell signal at the next market opening price.
The second thing to know is how many ETFs you have decided to own every day and list the Buy Symbols starting at the top of chart 1B.
Now sell all ETFs not on your new list to own and buy everything that you don�t currently own. How simple is that?
Your only other decision is how much cash do you want to invest in your portfolio of ETFs. Our recommended minimums are 5 ETFs and $800 per ETF for a total of about $4,000. For these minimums, we suggest you use a low commission Broker such as Interactive Brokers at $1.00 per trade.
Assuming you decide on a portfolio of 6 ETFs to start, each evening you divide your new portfolio value by 6 and use this �replacement value� to replace any ETFs as necessary using the simple rules above.
Remember: -
First, sell all sell signals.
Then, sell all positions not in your new list of top-ranking replacement ETFs.
Finally, use your new �replacement value� to replace all sold ETFs by top ranking ETFs from chart 1B at the next market open.
This will maintain your portfolio every day in your quantity of positions that have the highest current performance rank.
You will notice that in column 5, you see the sector of each ETF and whether it is a Bullish or Bearish ETF. For an example, when the markets are generally going up in a strong bullish trend, 20-year Bonds are likely to be bearish and going down.
Gold and gold miners are also likely to have less value when markets are strong.
These ETFs are highly leveraged and should not normally be held for long periods due to the high cost of creating the leverage and renewing the leverage daily by using options.
Our average trade using our rapid entry and exit algorithms, have historically been less than 10 days. Quite often they will be for 1 day only. These leveraged ETFs can easily have daily movements of 10% and more.
Best 5 to 15 ETFs & the 2-Day Bank Rule.
The 2-day banking rule where you must wait 2 days for cash from a sale to hit your account is easy to handle.
The easiest way to handle it, when possible, is to open a Margin account and automatically borrow the money for the 2 days that you may have to wait.
Certain accounts such as IRA pension accounts cannot do that. In this case, wait until the funds hit and buy the next currently highest performing ETF from the signal performance chart 1B.
If your account has available funds, do all sells and buys at the next day�s open.
I usually go down my account holdings, which in most cases is in alphabetical order and take care of any �sell� signals first.
Then I look at my account value or use the value that I have assigned to Roebuck Systems and divide that sum by the number of positions I intend to hold.
I can now look at the 1B signal chart and decide which are the highest performers that I need to place buy orders for tomorrow�s market opening price.
You will normally be selling when you see a �T� indicating the first day of a new sell signal, but your new buys will be selected according to the highest ranking performers on the 1B chart and you will not wait for a first day �T� signal.
From the various comments that I receive, I realize that some investors can often test ideas or have preferences for specific sectors. Our published charts and results are strictly based on our signals and the timing and assets in the groups represented on our website.
What Will We Buy Tomorrow?
What Will We Buy Tomorrow?
The answer at 7:00 PM every evening.
Rules for Best 5 Buys group.
1. If we already own it and it remains a Buy in our Best 5 Buys group, we keep it.
2. If it is no longer in our Best 5 Buys group or has a �Sell� signal, we sell it.
3. If we have less than 5, we �Buy� the next highest symbols with �Buy� signals.
We will shortly be contacting you again as soon as we finish web construction for our new groups. Meanwhile: - . . .
. . . You will need a minimum of about $800 for each symbol, and we recommend a minimum of 5 Symbols or any quantity up to a maximum of 15.
Place all Buy and Sell orders at your convenience at the next Market Opening Price.
To save lots of money, we use and recommend Interactive Brokers (worldly online site at $1.00 per trade) and Tradier Brokerage (simple online site at $3.49 per trade).
We offer Free Blog Membership to all Followers and a 30-day Free Trial to all Subscribers.
Trading at Tomorrow�s Opening Price.
You will also notice that when you do a BUY trade at the open, the market will often be down, and you buy at a lower price but by the end of the day you are back to even or in profit.
The reverse often happens when you do a SELL trade. You close out with a higher price but would have sold lower by the end of the day.
This is a result of the rapid entry and rapid exit algorithms and their methods and another result being the average 10-day or less trade length.
The temporary chart RKE to the right has some interesting numbers at the bottom. This represents the 52 original ETFs or 26 pairs since July 11, 2019. I added the winnings at $1,810 and the losses at $752 for a total of $2,562.
In 11 days, we made 71% profit and lost 29%. This is just another very early indicator of decisions made entirely by the current algorithms.
However, we should only be buying currently winning ETFs and should be avoiding those with the losses.
They are very sensitive to potential changes in direction and send out signals with the slightest provocation.
On the other hand, they are historically more often correct than incorrect and that is how they work.
Remember they are totally designed to deliver a decision for tomorrow and not the day after. They must be completely recalculated every day for new decisions.
If you went to a casino with the secret knowledge that red was going to come up 60% of the time, you would be very happy. We are depending on real world happenings and real-world news on each asset individually and not just one decision for each day.
However, the result is similar. You can make one decision and be correct 60% of the time or you can make one thousand decisions and be correct on 60% of them. Either way will eventually give you a positive result.
Excitement or Conservatism.
I first started investing in my twenties and preferred exciting results.
I had emigrated from UK as Technical Director to Bristol de Mexico S.A. in Mexico and a fellow cricketer helped me invest in the Mexican stock market.
Three years later, I emigrated again to Union Carbide in Charleston WV where I opened my first US account at Merrill Lynch. This was a losing experience.
I was an early eSignal and other data feed customer and went to endless seminars for years, seeking the latest and greatest and exciting investments.
This was always a part-time job for me as it is for most investors but years later, after a business career in math, computers and engineering, I had more time to enjoy and think more seriously about investing.
My background includes a lot of math and with this and the enormous amount of data available to us today, we have slowly but surely developed these rapid entries and exits into a range of assets.
I mentioned the speed of these signals yesterday which also gives us a great advantage into leveraged assets. The leverage provides the additional market movement with greater profit streams.
We previously worked with volatility and with a program that improved professional portfolio management results. Using our booster algorithms with Exchange Traded Funds representing these portfolios, we could obtain 20% to 35% annual returns whereas they are producing 8% to 15% for the investing public.
By moving to high volume and leveraged ETFs, we could produce 45% to 75% annual returns, again by replicating their portfolios of stocks and bonds.
There is however, a secondary benefit to our rapid entry/exit signals. If you review the back-test charts on our various group pages, you can see our history of staying with profitable trends but avoiding opposite price moves.
This is where our change to 100% inversely correlated ETF Pairs became a key to our programs. Instead of getting out of a bullish short-term trend, we could quickly invest in the opposite direction by simply switching to the inverse side of that inverse ETF pair.
This also made possible the move to leveraged 100% inversely correlated ETF pairs. Here, our signals can make about 2x the profit from the 3x leverage that is available from these daily adjusted ETFs. With average 10-day trades, we could overcome the high daily management costs and still profit about 200% of the 300% daily adjusted movement.
That brings us almost up to date.
As often mentioned, there are about 26 leveraged ETF pairs that we can reasonably work with today. We follow all 26 pairs plus a few others and like all assets, these pairs have their own trends. They are mostly short-term trends leading to longer-term but not always.
We follow these trends and calculate which ETF pairs are currently profiting the most from our algorithms. We are in the process of making that information available to followers so that we can stay in the pairs at the top of that list.
But more than that!
We no longer are required to stay with the pairs concept. We will offer the current most profitable leveraged ETFs, regardless of pairs and regardless of bullish or bearish direction. Why not go with the highest current returns with the highest potential return on investment?
Remember that our speedy algorithms continuously work in both directions of leveraged ETFs pairs and they also work 365 days of each year, no matter the direction of the markets!
Our new groups will include the Best 5, Best 10 and Best 15 leveraged ETFs based on current recent performance. We will trade in and out every day and you can follow our groups or select your own preferred groups all year round.
We now recommend no more than 15 in a portfolio unless a �BUY� signal exists, in which case, you may decide to keep these additional ETFs until the first day following a new �SELL� signal.
Conservatism can still be applied with 365-day trading.
Weekends and Denominators.
Our new system results will be 25% worse on Monday due to weekends.
The sample I am showing above was only 8 days old and there is little chance of any upward movement when markets are closed for the weekend.
On the other hand, a downward move is guaranteed by 2 more days added to the 8-day denominator for a 20% hit.
I did think about using market days as the denominator in the early days but to be honest about it, I was too involved in the algorithms at that time. Besides, it wouldn�t represent the facts.
This does not take away from the enthusiasm we have for the renewed algorithms and using them in this new signaling method. The results will demonstrate these improvements.
The key to this is the speed at which we can get in and out of our positions in very volatile leveraged ETFs.
A Look into Future Algorithms.
Maybe we chose a good day to start? I have no idea why we chose July 11, 2019 to modify our program above, but I was very sure that we had a better way.
The numbers since July 11 have been developed in the same way that we always produce and distribute signals and we expect to restart our program within the next 30 days.
As previously stated, we will bring more information to the Blog when available.
Thanks for your continued interest.
By Way of an Explanation.
We are temporarily stopping signals going out tonight to followers due to our need to make some changes.
The Blog will continue and information as it becomes available will be indicated and the short wait of less than a month will be well worth it.
Nobody is being charged for this period and nobody must continue with our signals when we resume them.
Our results for the past 3 years can be found on the Historical Data page and future results will include significant improvements.
In the meantime, I strongly advise followers to take advantage of the lowest Brokerage fees available whether you continue with Roebuck Systems or not. Be prepared for the possibility of a few more trades with additional profits.
We continue to use Interactive Brokers at $1.00 per trade in the USA with a very reliable and substantial world-wide reputation.
We also use Tradier at $3.49 per trade, also reliable with an extremely easy site to trade and hold accounts. They also offer $200 or 60 days of free trades to new accounts using the code ROEBUCK200.
I must add that we have no financial arrangements with either of these Brokers, other than holding investment or test accounts with them.
After continuing to research and develop our mathematical algorithms, we do have some significant changes and improvements to make. We regret the need to pause for a short while and hope to keep you interested in our service.
I do advise that any current investments of ETFs or Stocks, based on our signals, should be sold at tomorrow�s opening price.
Thanks for continuing to follow us. I enjoy doing this and it does not feel like work to me, but changes must be made. As I have noted before, �There is always a better way�
Wait 1 Day and SEE the Difference.
Stocks were up by 1% yesterday and ETFs are back up by 10% today.
My comments yesterday included the ability of ETFs to trade in both directions and today we see the benefits of that.
To be precise with these results, we must first know whether the investment is in 5, 10 or 20 different stocks or ETFs.
No matter which group is selected, the benefits and reduced risk with inverse ETF pairs is important every day and worth knowing and considering.
Stocks Overtake ETFs Today.
80% average annual returns after brokerage fees for stocks today versus 79% for ETFs.
Not surprising to longer term followers as ETFs have had more difficult markets lately compared to stocks at new highs.
Of course, current stocks are measured over the past 29 days and current groups of ETFs have been running now for 137 days. Timing always plays a part with these comparisons.
We have had both in front at different times, but the more interesting fact is that we can average these levels at all.
Our most conservative groups of 20 stocks and ETFs have averaged 48% and our most aggressive groups of 5 stocks and ETFs have averaged 114%.
Looking back without checking exactly, I can�t remember a time when our results were not at least in this area and many times we have seen better.
Stocks will naturally suffer during down markets, but these inverse ETF pairs just keep on going no matter the market direction and their ability to quickly change sides.
A week or so ago, I was referring to the speed that we get in and out of positions and this review came about as we were measuring whether we should switch sides or perhaps switch pairs and we have some very interesting results coming out in the future.
However, today we look at all 6 groups that we currently offer with average returns around 80% and individual returns from a low of 47% and a high of 126% and pause to appreciate them.
Risk is a subject that has always been an important consideration for us, and inverse ETF pairs for the last 3 years deserve serious consideration.
Experiment Develop and Analyze.
When does your work change from experimenting to developing and finally to looking back and analyzing?
My answer to that question is 2018.
For 3 and more years we experimented with various tradable assets and repeatedly found positive results mostly over short periods of time.
One of the common factors seemed to be shorter length of trades no matter what asset was being tested. We now have historical facts showing average trades of less than 10 days and some reversals in just 1 day.
Both facts confirm that our algorithms support fast entry and exit from trades and staying with profitable trades at least for an average of 10 days.
Using the recent Exchange Traded Funds market and the more-recent inversely correlated ETF pairs, we find that our algorithms work equally well in up or down-market conditions.
Their fast entry and exit also performs well with leveraged ETFs where the excessive management costs specifically require short-term trading.
History also confirms their ability to stay with longer-term trades if required. We recently bought 11 shares of DGAZ, a 3x leveraged ETF on March 1 for $970 and held them for 119 days, finally selling on June 25 for $1,809, This was a profit of 94% at an annual rate of 288%.
To be fair, we also recently bought 10 shares of UDOW, another 3x leveraged ETF on March 1 for $990. We held them for 94 days, selling on June 3 for $840. This was a loss of 15% at an annual rate of 58%.
So, we experimented with algorithms and then developed their ability to work in multiple investment markets.
The above comments plus the Historical Data page on our website confirm these various markets and trades. We are confident our results will lead to continuing opportunities in the future and we are making some helpful and positive changes that will benefit followers.
Some Statistics Since March 1.
The following numbers are taken from pre-published trades and their results since March 1, 2019.
Bullish winning profits were $3,547 from 17 ETFs and bearish winning profits were $2,222 from 11 ETFs.
That is $209 each from the 17 bullish ETFs and $202 each from 11 bearish ETFs.
This also represented 61% of profits from bullish trades and 39% of profits from bearish trades.
All this makes some sense as the S&P 500 is up almost 8% over this period.
If we look at total dollars including losses, bullish profits were $2,750 and bearish profits were just $812.
In this case, bullish trades made 77% of the profits and bearish trades made significantly less at 23% of the profits. This indicates that losses were more likely on the bearish sides than the bullish sides.
This also seems to make sense as the markets had a bias to the upside of almost 8% during this period.
For the record, one bullish ETF and one bearish ETF did not trade at all, so the results are from 25 bulls and 25 bears instead of 26.
Why do we include these statistics?
The reason is to demonstrate that during any general market trends, we switch between the bullish and bearish sides of these inversely correlated pairs to take profits from both directions.
This is the reason we can trade for 365 days a year. If the S&P 500 had gone down 8%, we mostly likely would have made more profits from the bearish sides of the same pairs.
Lower Interest Rates Indicated.
The indicated lower interest rates should be good for markets but global slowdown not so good.
The good news is you are now trading inversely correlated ETF pairs and our algorithms put you in the best direction, up or down, throughout market trends.
The advantage of being in leveraged ETFs is the trades will average less than 10 days which works for short-term reversals as well as long-term trends.
You will find many of our best performing ETFs are in the bullish sides of the pairs but also in the bearish sides.
This is exactly the benefit of being able to trade 365 days each year, no matter which direction the markets are moving.
This soon anticipated interest rate reduction will give a short-term boost and most likely, a short-term rise to US corporations. However, the rest of the world is slowing down and this will likely move markets in the opposite direction.
We used to trade options, as one of the main ways to trade direction, but the rapid reduction in time-value makes it a higher risk and higher volatility method of investing.
We can trade a selection of 3x leveraged ETFs in both directions with low risk. This can provide the kind of profits available to option traders but without the rapidly changing time-value.
We can also trade virtually anything in both directions, from commodities to bonds, plus most of the stock indexes and sectors in between.
How Many ETF Pairs are Enough?
We have usually suggested a minimum number of ETFs to follow is 5 pairs.
One of the difficulties is the number of energy-related pairs meeting volume requirements is also 5 and this can sometimes be a problem.
Duplicating sectors such as energy, in a small group of ETF pairs can increase volatility of portfolios considerably, even though the pairs represent different underlying assets within energy.
Due to the high volatility of 3x leveraged assets, it is always beneficial to decide how much volatility is acceptable.
On the other end of the scale, we are aware of having too many ETF pairs. Followers will know that we recently reduced our published groups to just 20 of the 26 pairs that we continuously follow.
This is due to only 26 pairs can meet our requirements and the volumes necessary to be included.
Performances of these various pairs and sectors have varied considerably over the 3 or more years that we can refer to. Our conclusion is that the 6 pairs out of this total of 26 available pairs can be eliminated from consideration for 30-day periods, beginning each month when we make up the various groups.
Our current results suggest that the maximum of 20 pairs in our largest suggested groups may also be too many. We may be better off by reducing that largest group to 15 pairs.
We are considering this change to our groups which would be the 5 Best, 10 Best and 15 Best pairs each month. This would leave out 11 of the total pairs as backup selections for future months.
Recognizing Good Charts.
We like to show the back-test charts for every stock or ETF that we follow below the group charts on each page.
These were useful to us during the developing process of the algorithms.
This first chart of DGAZ shown below was the best gainer as of the market close yesterday and shows the percentage of gains and losses for the past year through June 28.
The red dotted line shows where the actual price of DGAZ declined over the year and the green line shows the gains with all trades detailed below it.
Obviously, this is one of the best charts showing how the 3x leverage worked to generate huge profits from the opening price on Nov 29 to the open on Jan 2 when we sold it.
This is a good example of how we use 100% inversely correlated ETFs. We were able to profit greatly from the decline in the price of natural gas by owning an ETF that moves in the opposite direction to the underlying asset. Starting with about $10,000 (134 @ $74,40) we ended up with $65,392 according to this back-test.
The second chart for UGAZ is the bullish side of the pair and generally moves in the same direction as the underlying asset. Starting again with about $10,000 (158 shares @ 63.13) our algorithms were able to pick away at the movement and end up with $25,327 by Jun 38.
Together this pair of back-tests produced a total of over $90,000 from a total starting capital of $20,000 or a 450% profit while the actual prices of this ETF pair lost almost 100% each in management costs.
These are back-tests and not actual trades, but the same algorithms are now used to determine future trades. Notice how these algorithms can make profits from straight line performance and avoid large downturns.
Opening Prices and 3X Leveraged ETFs.
Opening prices on most leveraged ETFs can be nerve racking to watch, especially when you are buying them, and you get to pay large premiums.
It feels like those high daily management costs are all being paid for by the buyers at the market opening price.
Fortunately, we sell as many shares as we buy in the long run so whatever and whenever they are paid, we see both sides of the coin. Unfortunately, this just means we get to pay those high fees sometime in the investing process.
We know we are working with ETFs that have this 300% leverage and historically, depending on market directions and volatility, we have long-term results showing a net benefit of about 200% in our trades or about two thirds of the leverage.
Today on ETFs we ended up with a loss of just $9.00 total, and on the new stocks, we lost $231.00 total. Both groups started with a total investment of $35,000 on our 4xxs chart.
At the end of the day, it is difficult to say that we lost less on the ETFs because of the leverage or, put the other way, we lost more on the stocks because they have no leverage. It is more likely that we lost less on the ETFs because we invest in the opposite direction, whereas with stocks, we must move into cash.
The problem here also reflects an earlier comment that ETFs mostly represent multiple assets such as the S&P 500 and the stocks are single organizations. It takes a lot more money to move 500 stocks (or options) the same distance as a single stock investment.
Double Your Money with Algorithms.
We display this statistic every day in our stock charts, but it isn�t something you see at first glance.
Look at the 5 Best Stocks page at the bottom of the column heading �12 Month Stock Gain�. Today you see the average annual gain of the 5 stocks increased by 115%.
Now look at the last column heading �12 Month Algo Gain� and you see at the bottom of the column by using our algorithms, the average stock gain was 256%. Double your money + plus a bit.
You can do the same with the 10 Best Stocks chart where today you see 98% versus 194%. Almost double.
And you can do the same with the 20 Best Stocks chart where today you see 91% versus 179%. Almost double.
This doesn�t calculate with ETF Pairs because the bullish and bearish sides move in opposite directions.
However, it was this doubling of annual returns on almost any selection of assets that first grabbed our attention. We then started to look at professional investment portfolios that could also be doubled. For example, many managed trust accounts that traditionally make 9% annual return could now make 18% using our algorithms.
At that point our research told us that many professional managers were turning to ETFs or Exchange Traded Funds. These now trade in very large volumes because they are more efficient than Mutual Funds.
From there, it didn’t take long to jump to Leveraged ETFs and finally to the newer 100% Inversely Correlated Pairs of ETFs.
It stands to reason that if you can double a whole range of tradeable assets, you may as well go fishing for assets that already have a high annual return rate.
Stock Current Ranking Chart.
We mentioned that the new Stock ranking numbers only represent the profits since June 17 for this July month.
As this period is fewer days than a normal minimum of 30 days, the attached Ranking Chart RK shows the same results in order of profits realized.
This column is useful for subscribers who like to make their own selections.
It is also possible to make selections that might include ETF pairs as well as stocks but there are some details to consider when mixing.
ETF pairs are ranked as pairs because we want to have the opposite direction available to us if the algorithms are seeing a direction change for the next day. Of course, followers will know that the change in direction does not always occur on the following day. Very often we see a pause and a resumption in the same direction.
Many times, we get the undecided signal which means we stay out of both the bullish and bearish sides of the pair with 2 Sell signals until the decision is more clearly triggered.
One interesting capability of these algorithms is to consider the ETF pairs as individual investments rather than as pairs, similar to the way we are now considering individual stocks, but we will report on that in the future.
The reasoning for that is why wait for a lower profit direction change when you may have the availability of a higher profit opportunity in a completely different sector.
Apologies for Housekeeping Yesterday.
Yesterday was a day that got away from us on some housekeeping and we apologize for that.
Bringing stocks forward to July instead of August was a worthy goal but a more complicated job than we planned.
Some charts had some misleading text and a few other glitches, but I believe we have everything under control now and the numbers and symbols were always correct.
I do want to reiterate that some values do continue changing from the closing price due to afterhours trading.
These are all self-correcting, but a few questions do arise because of this detail.
It is also true that we only had 2 weeks of actual trading on the new stocks that are offered for July instead of the normal month that we usually like to have. This affects the relative profits between the 20 selections and will cause the ranking of profits to vary more than usual for the best 5 and best 10 groups at month end.
Some followers may prefer to wait for August so that more current history is included in the group selections.
This is also the first month that we limited duplicate sectors from our smallest 5 Best ETF Pairs group. We are limiting the Energy sector to a single pair in this group because their volatility can takeover 3 or more of the 5 positions and result in extreme value changes.
This limit can be overridden by followers who are prepared for higher volatility. It should tend to be more profitable over time, but new followers often start with fewer selections which would be affected more by this decision.
You can always choose your own �5 Best� by reviewing the 20 Best group charts for ETFs or for Stocks. Then check the column heading �Gains Since ����.
Some Back-Test July Statistics.
Some comparisons between the back testing of ETFs and stocks may be useful.
The average number of days invested in the past year for 26 pairs of ETFs was 304 days or 83% of the year. This is the total of both sides of each pair.
This breaks down to an average of 165 days or 45% of the year for bullish ETFs and an average of 139 days or 38% of the year for bearish ETFs.
Comparing the above ETF total of 83% to stocks, the average number of days invested in the past year for 20 stocks was 255 days or 70% of the year.
Stocks are only invested during bullish trade periods as above or 70% of the year. ETFs are invested in bullish plus bearish directions for a total of 83% of the same year.
The simple answer would be to say that ETFs should therefore make 83%/70% = 119 or 19% more profit than stocks if all else was equal.
There are two opposing facts to make this comparison difficult to know.
First is that a stock represents a single company whereas ETFs, in most cases represent multiple assets. This tends to reduce the overall advantage of the ETFs by averaging the results from their multiple assets.
Second is the 3x leverage of most of our ETF pairs, which tends to increase their overall advantage.
There is a third factor which may further complicate the results. The back tested average length of just the bullish ETF trades during the previous year was 39 days and for bearish ETF trades alone was only 17 days.
The same back test for trading stocks in the bullish direction was 31 days or 26% shorter than bullish ETFs and 82% longer than bearish ETFs.
Concluding these back-test results: -
Bullish ETF trades last for 39 days.
Bearish ETF trades last for 17 days.
Average ETF trades last for 28 days.
Bullish Stock trades last for 31 days.
Note - All the above data applies to the past 12 months of back testing only and does not apply to future trades.
Changes to Groups in July.
There are limited first-day stock signals today and most new stocks are Buys from previous signals. With ETF leveraged pairs, we recommend trading on the first day that a signal changes because they require short-term trades.
With new stock groups, we can expect longer-term trades and more flexibility to make initial buys. Risk-averse buyers should wait for the first day buy signal with a �T�, whereas some investors will buy all stocks with previous buy signals.
New months and groups always sell stocks that no longer belong to groups. Items that are sold are always replaced by higher ranking ETFs or Stocks.
There are times when being in multiple sector pairs such as Energy, is very profitable but the increased short-term risk creates more portfolio volatility.
In the long run, this can make higher profits, but subscribers (if they wish to) can choose this higher risk with duplicate pairs from the �Gains Since� columns on the various group charts or the �20 Best ETF Pairs 3x� chart.
Newcomers to leveraged ETFs will soon get used to making these choices.
Our 10 Best and 20 Best ETF groups will continue to be based on recent profitability and duplicates will not be eliminated. There are 5 various Energy pairs, and these can be eliminated or replaced according to personal preference.
Gold Mining and Volatility pairs will return in July and Semiconductors and Russell 2000 will be dropped from the 20 Best Pairs.
I had a question this week reminding me to mention that all current rankings appear on the �20 Best Pairs� chart in the column �Gain Since March 1st�.
Some subscribers select their own favorites from this list and signals for all 20 of them are provided each evening.
The same Buy or Sell signal applies to all three of our groups and this is the single source for all current month signals for the 20 pairs being offered.
If you wish to keep a record of trade signals each day, you should keep the daily signal Chart 1A for the current month until the end of that month. All previous month trades are added to the Historical Data page when we start each new month.
We are also adding Chart 4XSS to the Blog today for a preview of the current status of our new Stock selections for July, along with the existing ETF Pairs groups.
The stock groups only have 11 days of history, whereas the latest groups of ETFs have 118 days. Annual returns for stocks will be quite volatile until more history is included.
A Few Stocks May Change in July List.
Earlier in June, we showed details of our new 20 Best Stock program that begins on July 1.
It may be necessary to change a few of the stocks that were listed but otherwise the program will remain the same as previously indicated.
We started trading the 20 stocks on June 17 instead of waiting for a complete month of history, but all is working as anticipated.
Many followers have indicated their interest in getting back into stocks and we are pleased to start back again.
We gave a few additional statistics out in the past few days and the summary charts 4X for ETFs and 4XS for stocks will continue to report many of those daily details.
The individual charts on each of the Best group pages are also updated and renewed every evening.
At the end of each month, we upload the latest month of trades onto the Historical Data page, but those current month daily trades will not be updated until the next month end. The only way to get the current month daily trades every evening is to subscribe. Otherwise a complete history of every trade can be found on the Historical Data page.
The new chart 4XSS combines the daily results of the 20 ETF Pairs and the new 20 Stocks program for easy comparison. Looking back over 3 years, ETFs and stocks have both held the best performance position at various times and there is no reason to think the future will be any different.
The main reason for differences is our ability to trade both directions with the inverse ETF pairs, whereas the stocks must move to cash when markets work against them.
30% of Trades Only Last One Day.
To complete some similar analysis to yesterday�s Blog, we looked at our shortest trades.
One unusual trade for DGAZ lasted 116 days as recorded yesterday.
Today we are reporting that 79 of all trades in all 26 pairs during this same period, only lasted for 1 day. We signaled a Buy and then signaled a sell on the very next trading day.
During this period from March 1, we signaled 266 completed round trades with 79 or 30% lasting for only 1 day. The algorithms changed very quickly.
This is all part of the calculations that take part every day for both sides of the 26 suitable pairs that we can follow. Individually, that is 52 ETF decisions every trading day.
For this 116-day period since March 1 until today, that works out to be 266/116 = 2.3 completed trades each day. If 30% of these trades will only last for 1 day, that would be about 70% of all trades that remain for more than 1 day.
It turns out that of those 79 trades, 45 of them made a larger loss than the other 34 made profit. Therefore, the decisions to cut those 79 trades did make a small loss. The amount of loss will vary with the amount each investor had invested but ours was less than $1.00.
Finally, the remaining 187 or 70% of trades that lasted longer than 1 day made a profit. This amount will also vary with each investor.
Investing logic tells you to get out of losers quickly = 30% and stay with your winners = 70%. By this rule, our algorithms are making good decisions over this period since March 1, 2019 until today.
Here are our percentages of actual trades that made a profit for each group. (Reported yesterday on the bottom of Chart 4X and every day).
10 Best ETFs = 6530/2709 = 71%
5 Best ETFs = 3739/1486 = 72%
DGAZ � Completed Very Unusual Trade.
On March 1, 2019 along with all other current groups, we purchased DGAZ for $88.14 at the open.
The average trade in these leveraged Exchange Traded Funds would be held for less than 10 days.
This unusual trade was held for 116 days and made a profit of about 95% at an annual rate of 300%.
This profit follows a loss of 12% just in the last 2 days alone.
Leveraged ETFs are not normally bought for long-term trades due to their high daily management costs.
So why did our algorithms hold this ETF for 116 days and make this large profit?
The main reason for holding on to this position seems to be the accelerating decrease in the market value of natural gas over this same period. There were reversals in market value but not enough to affect the algorithm until yesterday, June 24 when we advised selling it today, June 25 at the open.
DGAZ is the inverse side of this natural gas pair and made strong profits as the value of the underlying gas declined.
The more appropriate story behind this profit are the number of decisions to stay in DGAZ. Every market day during this 116-day trade, the algorithm made a new and revised decision to hold on for one more day.
Here are the percentages of profitable trades for each group as seen on the bottom of Chart 4X every day.
10 Best ETFs = 71%
5 Best ETFs = 76%
Despite Indiscriminate Volatility.
Exchange Traded Funds and Stocks trade inside of trends that can be short-term or long-term.
These various trends make up financial climates that each individual asset must react to and evaluate for themselves.
There are climates that last for years and there are known pre-specified dates such as single-day holidays.
The VIX Volatility Index follows some of these trends, but also reacts to the 6:00 o�clock news and today�s 24-hour news.
This can sometimes help and sometimes hurt but can�t be planned or expected.
This indiscriminate volatility cannot be part of our algorithms, especially as our signaled trades are for the next available trading day.
However, over various periods, it likely helps and hurts about equally, 50% of the time in each direction. If not equally, then for the past 3 or more years, we have overcome its effect on profits.
One of the known impacts of volatility, is it generally goes up fast and comes back down slower. For this reason, trends in volatility can be more profitable with declining volatility because they are more predictable and longer.
Inverse ETFs very much depend on volatility occurring when you are in the side of the pair that benefits from it. Leveraged ETFs can be painful when in the wrong side.
Stocks are dependent on volatility in all sorts of ways, depending on which stock you happen to be holding, but can be mostly hurt by rising indiscriminate volatility.
A final observation is that sudden rises in volatility are largely followed by sudden but smaller declines.
This requires judgement, as they could last for a day, a week or a month. Our algorithms can deal with those that are consistent and longer than a few days; often quite well.
Stocks Program for July � Part 3.
The 20 stocks chosen for the starting month in July will all remain as the Best 20 group.
However, the Best 10 and Best 5 stocks will be selected from those 20 stocks, based on profits from the starting date of June 17 through Friday June 28.
You may remember that we normally like to have a full month of profits when starting a new selection, but we are bringing the starting date forward to July 1 rather than waiting until August.
We are pleased with the new selection process and want to begin ASAP.
We are also pleased with the recent method applied to our ETF group selections and will use it on the new Stock groups as well.
The 26 suitable inverse pairs of ETFs currently available to us may slowly expand with the large increase in popularity of these inverse pairs. We will watch for new pairs to add.
It works out nicely that each month we drop the worst 6 pairs and offer the Best 20, Best 10 and Best 5, but this may not suit all investors.
I would not be surprised, if you chose to drop another 5 to create the Best 15, Best 10 and Best 5. Future trends and performance affect all selections and current world news events and associated volatility make timing the most difficult factor.
We see the approximate dividing line between profits and losses (in a 30 day period), is close to the 20 out of 26 Pairs line. This means choosing the Best 15 Pairs should be a better choice than the Best 20. We will leave that suggestion up to each Subscriber.
As a rule, for the future, when we find suitable pairs to add to our current base of 26 Pairs, the best and most conservative portfolio could be in the range of the Best 70% of available pairs. This would place a good conservative risk profile at about 18 out of the 26 pairs today. We are considering using this percentage concept sometime in the future.
Recall that trading both directions using inverse pairs together with our algorithms, reduces portfolio risk substantially. This remains true with leveraged pairs also.
Travelling Today � See New Stock Chart.
Sample of early stock results added to 4X chart. (Now $XSS Chart) Looking good for 4 days trading?
Stocks Soon Back � Part 2.
If everything works out as planned, stocks will be back on July 1.
We expect to follow the same pattern as the ETF groups and select the 20 Best Stocks. The �10 Best� and �5 Best� will be selected from the 20 Best.
We initially expected to start trading these stocks on July 1 and then begin publishing on August 1, but we were able to start trading on June 17.
This means that stocks will only have 10 trading days of history on July 1 when we normally rollover to the new month; less than we would like but worth doing.
The algorithms are fully back tested for 3 years with the same methods that we use for ETFs. By the end of this week, we will have the presentations for the website, Subscribers and Followers completed.
There has been a great deal of interest in stocks, but our main concern was to develop a better way of selecting which stocks to include.
We now expect to have a continuous ranking system so that each day you will see the complete monthly list of 20 stocks each evening with a column showing �Gain Since 17-Jun�. The 10 Best and 5 Best will be part of this group but also have their own columns.
You can see that these individual stock groups will be presented in the same way that the ETF groups are now shown. Subscribers will see a combination of two independent charts, one for ETF Signals and one for Stock Signals.
ETFs Pairs will always retain one ETF algorithm for trading up and the opposing algorithm for trading down, giving them this unique ability to profit in both directions.
Stock algorithms can only profit from trading up and move to cash in down markets.
Past results have shown that stocks can perform equally as well as ETFs, probably due more to the different trending characteristics, but also due to the selections available.
We have improved our selection process for stocks but may have fewer �high flyers� that have disappointed us in the past.
Stocks Soon Back in Our Program.
We have been testing better ways to include stocks in our program.
Followers will recall that we started with stocks 3 years ago and quickly found the advantages of Exchange Traded Funds and Notes.
There have been a couple of problems with stocks relative to ETFs in the past.
The first is making an appropriate selection of stocks that are a good investment on their own merit, without relying on our algorithms.
The other main consideration is we can only trade them in a single direction.
We have now improved our systems to include a much-improved method of selecting stocks along with improved algorithmic performance.
The stocks currently show better than a 230% average improvement when using our algorithms. They also share the same speedy in and out short-term trades that help their risk profile by staying out of downtrends.
They are often more sensitive to trends because they represent a single corporation whereas most of our ETFs represent indexes or sectors with multiple assets.
They will be out of the market during downtrends but will benefit from the longer trends that more often occur with single stocks.
The rapid recognition of direction by our algorithms will remain a key ingredient as it does with ETFs.
When considering the past few years of performance, stocks have performed almost equal on average to ETFs but often on a different time-cycle. This may provide opportunities for mixed portfolios, depending on your preference.
Stocks have an advantage of public awareness whereas ETFs are relatively unknown to many individual investors.
Professional portfolios are trading very large volumes of ETFs because of their subject variety and the much lower costs compared to mutual funds. Trading in both directions together with various degrees of leverage offer greater usefulness to portfolio managers.
eSignal Data Feed Corrections.
eSignal data feeds for Microsoft Excel spreadsheets comes through a program called QLink.
A while ago, there was a problem in getting opening prices during the balance of the opening day and some of them were incorrect.
A call to eSignal support indicated that the box on the QLink Options settings named �eSignal Desktop Compatible� should be unchecked and �Connect on Startup� should be checked instead.
The glitch has now been fixed and a reversal of the above is now required.
I don�t know exactly the dates that the glitch first occurred and the day that it was fixed but on some of our spreadsheets (and charts), we were publishing the wrong price for the first day�s opening price on that first day only.
I would have appreciated better service from eSignal (Interactive Data), when the problem started and when it was fixed.
However, I have reversed the feed and it appears to be publishing the correct prices since last week. If you are using these services and feeds, eSignal now assures me that a reversal back to the original settings is now required.
Naturally, I am sorry for this error but assure you that once we got past midnight on the first trading day for new trades, the data was always correct.
It was only charts or publications before midnight after making a trade, that may have had an incorrect purchase price, and everything corrected itself after midnight on that first day.
It makes no difference to any end results being calculated and published because the error was corrected on all following days after midnight.
Trading in Both Directions.
Inverse ETF pairs eliminate the old short selling method to trade both directions.
These unique 100% inversely correlated ETF pairs have one side that goes up and the opposite side that goes down.
Our algorithms choose up or down and give signals for the next market open.
They have been uniquely developed to choose the expected direction every day for each ETF and we distribute those signals to you each evening for trading.
You will receive all Buy, Sell, Hold or do nothing signals to place trades at your convenience before the next trade day.
You will always know which side to trade, whether it�s holding or staying out of positions or whether it�s the bullish or bearish ETF.
Reduced risk comes from our algorithms switching sides as the market changes direction.
Higher profit comes from trading in the best direction 365 days a year, and from the leverage offered by these unique Exchange Traded Funds.
Simplicity and convenience both come from our daily updated signals each evening and your ability to place your orders anytime before the next market opening.
This is a rapidly growing market with very high volumes every day, resulting in price spreads in the 1 or 2 cent range.
Savings from Rapid Trade Entry.
I often refer to our average trade length being less than 10 calendar days.
The additional information that generally goes with that statement is we get in and out of trades very quickly.
Why is speed of entry necessary?
Mostly because of the large daily cost generated by the producers of leveraged ETFs and that cost is due to the use of options that provide the extra leverage and daily movement of each ETF that we trade.
We have calculated a part of that advantage and its precise benefit.
In order to be able to trade leveraged ETFs, you must first absorb the high cost paid by Producer�s for those rapidly depreciating options.
Options incur large daily depreciation of their time-value because of the required expiration dates that always accompany these types of options. For example, an option priced at $3.00 that expires in 30 days has an average decline in value of 0.10 cents for each day until expiration.
In actual practice, the option daily loss increases as the expiration date gets closer to expiration.
A rough approximation tells us that by trading 3x leveraged ETFs, we can double our profits when compared to a none-leveraged ETF.
This is only possible because we developed faster entry and exit points for our trades especially to deal with highly leveraged ETFs.
This fast entry can be quantified at the point of entry on the first day following a signal to Buy.
The following prices are taken from widely published data giving the closing price on the day of our Buy signals and the actual settled opening price on the first trading day after our Buy signal was originated and published.
For all 26 ETF pairs followed by our algorithms, here are the results showing the average difference between the previous day�s close and actual price paid.
All 26 pairs, the gain was 0.11 cents.
20 Best pairs, the gain was 0.11 cents.
10 Best pairs, the gain was 0.23 cents.
5 Best pairs, the gain was 0.37 cents.
VIX Volatility Index Still Running High.
At the end of 2017, the VIX Volatility Index was averaging about 10.5, which was on the very low side.
The average has never been that low during the last 1 1/2 years and 2019 has averaged close to double that number.
We have pluses and minuses with high volatility, and it is difficult to assign which reason affects performance of our algorithms on each of the ETFs.
One significant factor is the increased gap between closing prices on one day and the opening prices on the next trading day.
This has a direct affect on our trades which are always placed for the next day�s opening price. However, it is likely that unexpected opening price gaps would balance out higher and lower fills over time.
We often see large gaps on the upside that work against our Buy signals, but we also see gaps on the downside which add profit to our purchases.
These same gaps also apply in the opposite direction for Sell signals but when we net them all together, they will end up being close to zero.
The affect that is most difficult to quantify is the haphazard volatility caused by the almost instant news cycles at home and around the world.
The internet brings market moving news in just minutes from wherever the news occurs.
We do see a negative affect from this unpredictable volatility, which has been in effect for 2 1/2 years. It has ramped up more since March 1 and is likely to stay around for a while.
The good news is that our average annual returns are staying above 100% even though recent results have been higher.
Gold Maybe Coming Back in July.
Which poor performing pair is getting worse and which is getting better?
When we look at Chart 1MG for future changes to our 20 Best Pairs from our inventory of 26, we are looking at changes to current low-ranking pairs.
Today, we see JNUG/JDST at rank 20 and NUGT/DUST at rank 17, both on their way up. We also see FAS/FAZ at rank 21 and UPRO/SPXU at rank 22, both on their way down.
That�s 2 Gold Miners improving and Financial plus S&P 500 Stocks going downhill.
Obviously, they would have to get to a rank of 10, to rise into any other current groups but those groups will also face changes of their own for July.
I just heard that algorithms decide which cartoons are funny on social marketing platforms and until now I hadn�t connected our algorithms with cartoons.
Of course, we are dealing with the same digital phenomena because profits generally come from more people buying and losses from more selling.
Another way of describing the above early, but possible changes for July would be to say Gold is a good defensive holding and Banks and Stocks are looking weak. Probably too simplistic for such short periods but true facts none the less.
A stronger conclusion might come from the 5 Best Pairs which currently look to maintain 3 Energy pairs, and China but may be replacing Emerging Markets with Silver.
All speculative as our rankings derive their positions from both sides of all pairs and we tend to change from bullish to bearish in short trades. It also depends on how fast each ETF is currently moving.
I think it more conclusive to see which strong pairs stay in our groups rather than which pairs are likely to be added or pushed out at the lower end of the rankings.
Energy looks at this early stage to be heavily weighted in the 5 Best Pairs.
Friday�s DGAZ Story and Other Facts.
On Friday I talked about DGAZ and the 98 days of continuous annual profits amounting to 305%.
It makes a good introduction to some other facts about our 26 pairs of 100% inversely correlated and leveraged exchange traded funds.
The worst pair that we are currently keeping you out of is LABU and LABD, a surprisingly lousy pair of inverse Biotech leveraged ETFs.
You would think that Biotech would be in a strong popular or unpopular trend but not at the present time.
Whereas UGAZ/DGAZ is currently making record annual profits of 305%, LABU/LABD is making annual losses of negative 142%.
Our algorithms currently produce profits from 19 of the 26 inverse ETF pairs. They do this in opposition to expensive daily management costs which are necessary to produce these highly leveraged ETFs.
The attached chart shows recently announced reverse splits by the Direxion Company which produces many of our inverse pairs. They all represent a significant and typical reverse split.
Most of them are a 1:5 ratio which gives you 1 new share in exchange for every 5 of your old shares. Similar splits will always be necessary to make up for the expense of maintaining the leverage.
This basically raises the current price of individual shares by a multiple of 5 to a more normal American share price-range.
Selections of time-sensitive options are used after each daily close to produce the published leverage required for the next trading day.
However, our algorithms are taking continuous advantage of this leverage to produce high profits, despite all the above daily costs.
Just as important is the reduction in risk achieved by our algorithms and their ability to trade these specific ETF Inverse Pairs in both directions.
An Alphabetical Happening.
I keep looking at these updated charts and graphs every day and the 5 Best Pairs graph finally needs an explanation.
Maintaining our results in alphabetical order works well at visually distributing the results of our algorithms.
It has to do with DGAZ and the very unusual results from this single ETF that defies what we know about leveraged ETFs.
It is easily the most successful of all the investments we have advised from all 26 pairs of highly leveraged ETFs for the following reasons.
In the current groups since March 1, DGAZ was a buy signal on that opening date and we are still waiting for a sell signal to complete the trade.
It is also alphabetically, the first in our 52 individual ETFs that make up our 26 original pairs and accounts for the rising initial bump most notable on the 5 Best Pairs graph.
It has been 98 days of continuous ownership and we pride ourselves in our rapid action algorithms that keep our average trade below 10 days.
The reason we need short term trades in these highly leveraged ETFs, is due to the high maintenance costs of daily re-balancing that takes place after the markets close each evening. This cost can easily be 100% and more on an annual basis.
DGAZ has currently produced $820.60 in 98 days on an investment of $1,000 and we are still waiting for that sell signal.
In this single trade so far, the current profit rate is 82% and the annual profit rate is 820.60/1,000.00 x 365/98 x 100 or 305%.
This is not normal and has a lot to do with the energy pricing since March 1, but you do need to know that if energy pricing had gone in the opposite direction, we probably would have made the same amount of profit.
Inverse pairs trading really is great!
The Speed of the Trade Decision.
The initial goals for our algorithms were very simple and somewhat na�ve.
Those goals were also related to stocks or options and had nothing to do with the inverse ETF pairs that we now trade.
The main goal was to devise a better way of selecting stocks with the aid of mathematical analysis.
Also, with the same type of analysis, but a more general approach, make better decisions on when to buy and when to sell the chosen stocks.
Like most people, oncoming retirement becomes more serious as time goes by.
I had been investing as a part-time job for most of my career and about 8 years ago, decided to use my mathematical background and apply it to my investing.
Early results were promising but quickly changed when each chosen stock would trend differently even within a general market direction and the speed of recognizing a change in direction became a most critical need.
This was when volatility took over as the main problem and in its turn, pointed us toward ETFs that surrounded the VIX Volatility Index.
In those days, Credit Suisse had an ETF with a monthly positive roll yield (XIV), which provided superior results to other VIX-related ETFs. Unfortunately, that was brought to an abrupt end when XIV was taken off the market overnight and was no longer available.
By this time, we had spent a great amount of time concentrating on short-term trend recognition and found that our same concepts worked well on stocks as well as other ETFs.
The next move was to ETF pairs and the fast growth of 100% inversely correlated ETFs. This development could possibly use a similar signal to buy one side of the pair and at the same time, apply it to sell the opposite side of that pair.
With some changes, switching sides could allow positive all-year trading by simply switching sides of an inverse pair. Our speed of trend recognition would allow us to take advantage of highly leveraged versions of these inverse ETF pairs.
There are a limited number of suitable inverse pairs, but enough to cover a broad portfolio of indexes and sectors to suit most investor�s needs.
With varying volatilities and 365-days per year of positive potential investing, we now offer several portfolios of 100% inversely correlated pairs to choose from.
Also, by making all trade signals for the market opening price, signals can be conveniently distributed to subscribers each evening for convenient placement at any time before the next market day.
US Supplies Too Many Barrels.
Energy Information Administration reports 6.8M barrels today, well above expectations.
ETF energy bears leapt into action from the open today as prices approached break even for some producers.
A few hours in, our bearish and leveraged energy ETFs were up 15% as prices dropped.
OPEC used to be the main irritant, but the US has become an equal partner with greater production, while the world needs to use less. I checked out the renewable energy index attached.
Attached is a chart of the $GRNREG Index and it seems to have only one main direction since 2012.
I use eSignal data feed and $GRNREG is a useful NASDAQ symbol for their Renewable Energy Generation Index. Let�s hope it becomes as well-known as oil prices and OPEC in the near future.
Our 5 Best Pairs group should do well today as we are on the bearish side for 3 of the 5 pairs. In fact, all pairs in the smaller groups are also repeated in the higher quantity groups by design.
We are constantly concerned about the concentration of any sectors in the 5 Best Pairs group because both up and down days have a greater affect on daily volatility.
We have currently decided that trending is the most important factor and changes on a monthly basis is an appropriate period to review contents of all groups.
Energy algorithms for ETFs have performed well for us since Mar 1 but not always from the same direction. The bullish side of oil services has performed best in the top 5 but the bearish sides of crude oil and natural gas outperformed their bullish partners.
China and Emerging Markets make up the other 2 ETF pairs in the 5 Best Pairs group.
When is an Error Not an Error?
The markets were about 8% below recent highs yesterday.
Barbara Kollmeyer at Jefferies indicates that �A 5% - 10% correction is vital for this stock market�.
10% is often quoted as necessary to maintain long and healthy markets but there is a strong up-market today so far.
We have steadily taken up bearish sides of our ETF pairs in recent weeks which has provided recent strong results.
Our algorithms follow whichever direction is dominating current trends as the attached chart demonstrates.
Although today is starting strong, we do expect to match daily market trends better than 60% of the time, but perhaps not today. It can take several days to adjust all ETF pairs in a group to their profitable side.
This chart, since March 1 until yesterday, shows 2 different views of our same results.
First is the orange line showing the steady increase in the value of all 40 ETFs from our Best 20 Pairs group, depicting results in alphabetical order.
Second are the exact same 40 ETFs in date order, showing how our algorithms turn trends into a steady rising profit.
Both lines show the current results ending with 23% profit, which is the same profit depicted on our daily 4X chart on yesterday�s blog.
Overlaying these results on the same graph offers the best way to view the advantages of 100% inversely correlated ETF pairs. It also demonstrates the speed and accuracy that they can change directions based on short trend reversals.
This combination of high speed and accuracy enhances their additional and unusual benefit of staying in investments all year round.
No longer are investors searching for stocks that are only moving up. These inversely correlated pairs give us the ability to efficiently profit from both directions simply by switching to the opposing sides of the pair.
No longer are investors having to use short-selling or options-trading to achieve some degree of benefit from reversals.
Inversely Correlated ETF Pairs can do all of that, and more.
When is an Error Not an Error?
SOXL and SOXS seemed like an error to most people and we heard the uproar.
The problem occurred because we introduced the new June groups today and SOXL/SOXS remained in the Best 20 group but was eliminated in the Best 10 and Best 5 groups.
To further complicate the issue, on Friday this pair changed direction for Monday�s open. We signaled to Sell SOXS and BUY SOXL in the 20 pairs and this was signaled to Subscribers.
The Best 5 are all included in the Best 10 and they are all included in the Best 20.
Unfortunately, because it was dropped in the other groups, they saw both as Sells and I don�t think I could have developed a system this complicated if I tried.
Only geeks like me who follow our 3 groups could possibly see the reasoning behind these crazy looking signals and I apologize to all for this and will take notes in preparation for future months.
I admit that I didn�t see the complication until being told several times this morning when it was too late to make any changes.
The problem I see in future is that fixing it might be to dishonestly change some signals around and my Mother would turn in her grave if I chopped that cherry tree down (so to speak).
However, an appropriate reminder and comment in future will be noted and we will find some way of explaining the problem as it happens. The same problem is likely to occur again without a good solution.
In the Best 20 group for today, we own 5 bullish ETFs and 10 bearish ETFs, so we are geared up for a lower close and more profits for our algorithms today. (This didn�t quite happen to the Dow)
It is interesting to speculate but 2 of the bullish ETFs are invested in bonds and volatility.
When stocks go down, bonds and volatility generally go up as those 2 tend to move independently and opposite to their bullish friends.
Just 4 days ago on May 30, our headline was S&P500 Down � Our Algorithms Up 23%.
Today it would be S&P500 Down � Our Algorithms Up 34%. See Chart 4X above.
Note - Changes at the open tomorrow for June groups.
Why? � Markets Down & We Are Up 7%.
Today, markets were down, and our 20 Best Pairs were up 7% and the 5 Best Pairs were up over 10%.
You can�t do that unless you trade in both directions. Roebuck Systems does it with algorithms and 100% inversely correlated ETF pairs.
Our fast-acting algorithms seek out the direction of each ETF for tomorrow and tell you what to buy and what to sell.
Then, they keep you in the trades for less than 10 days (on average), before reversing direction or getting you out.
It seems so simple and it is so simple!
Reversing directions doesn�t mean reversing everything on the same day. Our 26 ETF pairs represent a range of markets and sectors that often move by different influences or geography.
Bonds are an obvious divergent asset that mostly move in the opposite direction to stocks and shares. Volatility is another and is often held as a hedge against assets at various times.
At different times, we have recorded correct direction rates by our algorithms as low as 53% and as high as 75%. It is always dependent on many news and volatility factors that are difficult to quantify but we generally can expect over 60% as a longer-term average.
A rule that we use is to make new buys with the funds from the previous sale for all ETFs. This rule increases investments in the more profitable positions and reduces the less profitable ones.
S&P500 Down � Our Algorithms Up 23%.
Today�s reports going back 90 days to March 1 showed the S&P 500 Index was down by -0.3%.
Our algorithms published every evening over that same 90 days reported a current profit of 23% and an annual profit of 93%.
We publish these numbers every evening but on occasion, such as the end of this 3-month period, we like to confirm the results that our daily signals are providing to followers.
Following the markets all day is not necessary when following these signals.
The best way to see our results is to view our 4X Chart which records the daily progress being gained by our Subscribers.
To achieve these same results, all that is needed is a subscription to our 1A Chart to receive the signals each evening which signals tomorrow�s trades if needed.
If you read this blog, and review the Historical Data on our webpage, we have been producing similar returns to these with our algorithms for a few years.
The current results on Chart 4X are constantly adjusting each day and the statistics at the bottom of the chart display the ratios for wins versus losses plus the difference in dollars gained.
Looking at 100% Inversely Correlated.
Dow cuts losses in half but this morning we owned nine bearish ETFs plus bonds.
We also owned two bullish ETFs, so we are not pointing in the same direction on everything and not all bearish ETFs are currently making a profit.
There will be few days when our 20 Best ETF Pairs are all owned and in profit. Bonds are most often in opposition.
However, today does demonstrate that 100% inversely correlated pairs trading can uniquely trade markets in both directions and make it possible to be invested all year round.
Our total workable inventory of 26 inversely correlated pairs does not represent the great variety of segments that are a part of the S&P 500, but these pairs do have the ability to profit in both directions.
No short-selling is needed and no call or put options around a time-limited strike price is required. We just buy and sell them in the same way that we trade individual stocks.
Our advantage with rapid-response algorithms is our ability to buy and sell highly leveraged versions of these ETFs which are currently available in our 26 workable sectors.
There are some duplicates amongst the 26 pairs, but all 52 individual ETFs represent a very large segment of investment volumes being traded around the world.
These sectors mirror the major world indices as well as major geographical areas and major sectors such as energy, technology, finance, precious metals, bonds and volatility.
The traded volumes of these 52 individual ETFs runs from a billion dollars each day to a low around 10 million dollars and the bid/ask spreads are close to one or two cents.
The above volume and spread details allow us to conveniently place all orders at the opening price on the next trading day, and base the orders on signals from our algorithms.
How We Choose Next Month�s Groups.
We have previously discussed how we change the groups of ETFs for each new month and here is the answer.
The following 1MG Chart automatically updates each individual ETF from live results all day long and into pairs.
This ensures that as the markets change from bullish to bearish or the other way around, we always calculate both sides of inverse pairs each day for our signals.
I am showing the chart as it appears today because it tells the story of the past 5 weeks. Check the left-hand column for the current month.
Notice that as it stands today, two of the pairs that would be dropped are JNUG/JDST and NUGT/DUST. They are Gold Miners and the Gold Miner Index.
On their own, perhaps not a story but the third pair with declining rank is UWT/DWT, oil and gas exploration and not too far removed from gold mining.
When thought of together, they do represent some of the activities that might not be at the top of your list for speculation when you see portfolios of marketable securities losing value.
Owning lots of gold and energy reserves might be a good place to be, but prospecting for more of it, might take a back seat today.
This is an interesting way to introduce our 1MG Chart and what is likely to be the list of ETF pairs for our three groups in June. It is equally interesting to anticipate which pairs will be added, and the following might replace those three gold and energy pairs.
The first replacement could be ERX/ERY, and this refutes the above theory on exploration. Or does it? We really have two energy pairs that are just below the acceptable previous month profitability and one new energy addition that is just above that same measure.
In other words, a replacement that is just slightly better than those being dropped.
The second and third replacements could be both of our volatility pairs which can be best described as assets for hedging existing portfolios. In addition, they are a good choice to be owned during a steady decline in the VIX Volatility Index.
The conclusion could be that we have completed 5 tough weeks, so that we can now expect to see normal markets, or will we have more of these tough and volatile weeks?
A reminder that MarketWatch announced on Friday that 5 down weeks in a row for the Dow is the first such slump in eight years.
Markets are Down Since April 23rd.
MarketWatch announced that today is the FIFTH week in a row that the Dow finished in the red and the first such slump in EIGHT years.
So, we looked at how our current three groups performed and compared over this same period.
Our current groups all started on March 1 and we put the 3 group graphs together to get a combined look at how they look in comparison to each other.
See the attached combined graph of the 5 Best, the 10 Best and the 20 Best Pairs over this same period.
(Some followers may notice that we had an error in our charts and this exercise of putting them together highlighted the error for us to correct).
As always, the 5 Best is likely to outperform the 10 Best and 20 Best pairs.
This occurs because they represent fewer but greater average returns, but they also suffer from higher volatility simply based on spreading the highest returns over fewer selections.
You can easily see from this combined chart that the smaller groups do show higher volatility. The black dotted average lines consistently produce higher profits as the fewer number of selections is followed.
This short-term volatility is the daily short-term risk plainly represented by seeing these charts together.
It should be noted that these charts only show the current return over the last 84 calendar days since March 1.
The annual returns as seen on our 4x chart every evening or on the individual website pages currently show profits of 114% for 5 pairs, 85% for 10 pairs and 65% for 20 pairs.
Tariffs and Brexit � Double the Trouble.
Winston Churchill liked Free Trade and Europe working together in a Common Market.
The financial markets looked at both prospects today and decided Winston is no longer running the show.
This on-again, off-again volatility creates conditions for nimble opportunists to be rewarded more so than not-so-nimble predictors of history repeating itself.
We still maintain an average of 1.8 wins for every losing trade since March 1 and winning trades of $2.10 for every losing trade of one dollar.
We need an extra day or two to become established in the opposite direction, but we are not always going to be granted the time that we need.
When markets are frothy and volatility jumps up by 15%, it doesn�t always work in our favor. This is multiplied in the energy sector with multiple leveraged ETFs.
The long weekend ahead of us will see a lot of traders pulling out of the markets so we may also have to forgo a bounce back.
Interactive Brokers � Quick Response.
Received a detailed response today and it seems to be that UK and EU investors and maybe others have a problem.
I was not aware of this but here is the response with thanks to Jon: -
The issue is an EU �PRIIPS� regulation which from Jan 2018 requires all retail fund products sold in the EU to issue a �key investor information document� or �KIID� - this is a terrible regulation (as many EU ones are).
Many US ETF issuers have not bothered to do this given volumes of their ETFs traded in Europe.
And so, such ETFs cannot be bought by EU based retail investors.
Individuals that qualify as �professional investors� can avoid this regulation - typically 500k in liquid assets etc.
Other options are to use spread betting or contracts for difference which should not be caught by the regulation.
Thanks again Jon, it looks like you have Brexit and we have our own problems!
My relatives have previously opened accounts in the USA, but I have no idea if that is still a possible solution or not.
Our commission of $1.00 for a 500-share maximum is difficult to beat and may be worth any additional cost.
About Interactive Brokers.
I often Skype my brother in the UK and he went through the process of opening and funding an account with Interactive Brokers over there.
He likely did it based on my experiences and comments about my own accounts with them, but I only have experience in the USA.
Apparently, the USA is different to the rest of the world and they have more stringent rules about who can trade these ETFs in the UK.
It may just be the leveraged ETFs due to their volatility and management costs.
However, if anyone out there is also not able to use them, we would appreciate knowing so that we don�t recommend them outside of the USA.
The only problem we experience is the maximum share count per order of 500 shares, but this is easily overcome with an additional order and commission of $1.00 per trade.
Our other broker at Tradier does a great job also and their commission rate is 3.49 per trade with no restrictions on quantity.
We are pleased to pass along the names of other brokers if you are having good experiences with them or even if you have come across others with restrictions like Interactive.
My Market Watcher�s Notes.
Today started off this way and although things can change, I wanted to explain a point that I have noticed about our algorithms.
It happens more times than normal that when we have a Sell signal, the ETF will open at a higher level and proceed downwards sometime during the day.
This also occurs with Buy signals that open at a lower level and proceed upwards during the day.
We notice this more often than normal because of our concentration and emphasis on the next completed day. Look at the 4X chart above with today�s numbers at 2.2 + 1.7 + 1.9 = 5.8/3 = almost 2 wins for every loss.
Our algorithms look at tomorrow only and need to run every day after that. While they cannot be correct all the time, they do have a strong record of being correct on a day-to-day basis.
This unusual behavior can be disappointing if you spend a lot of time watching the markets early in the morning.
I know because I do it, but that is why we see this phenomenon and think it may be worth pointing out.
It stands to reason that when you look at history in all its forms, you are looking at completed days when history usually does not say what time of day it happened.
This is true for financial history as well as news items around the world in completely different time zones.
When markets open against me, I have adopted the attitude of waiting until the close to make me feel better.
I have also adopted the habit of looking for the turnaround during the day, or if not, that quick move in my direction during the last trading hour.
I have previously mentioned that I used to be a card-counter before they introduced those darned shuffling machines. The numbers game can also work for investors.
Looking at Profit Trends.
Maybe we spend too much time analyzing everything but that�s the only way we can improve our service.
This time we noticed some results that help to explain the short-term risk that exists with our algorithm signals.
It stands to reason that the greatest fluctuations in profit and therefore in risk, occur when you invest in the smallest number of ETFs.
We noticed a good demonstration of this in our Best 5 Pairs group and thought it was a good example to show why this seems to be true.
Taking numbers from our chart for the Best 5 group, we see that the start date was March 1. By April 1, just 31 days later, we show a profit of 20.66% or 20.66 x 365/31 = 243% annual profit.
I would like to maintain that return but here are the facts. By April 12, which was then 42 days later, we show a return of 14.11% which by the same calculation, provides an annual profit of just 122%.
So, we had a draw-down of 32% in those 11 days which in turn, reduced our annual projected return by 121%/243% = 50%; a much larger annual draw-down than the current draw down of 32%.
Next, we went until May 6, before overtaking the earlier current profit and closed the day with a 21.68% profit. This resulted in a new total when calculated out to be a 120% annual profit.
Finally, we closed out today with a current profit in a total of 77 days since March 1 of 31.02% profit or an annual projected return of 31.02 x 365/77 = 147% annual profit. You will also see this number on our daily report on the 4x chart each evening.
A couple of things to remember are that our charts reflect our Historical Data page, which has mostly recorded our ETF results in alphabetical order each day for convenience. This means that the shape of our graph changes but the final total each day is correct.
The final thing to remember is that an annual return of 147%, as of May 15 and since March 1, a period of 77 days, is well worth remembering.
Annual Return Up 8% Today.
We are pleased to see the volatility spike moving back down closer to its annual average value.
Five days ago, it was over 23.38 and closed at 15.29 today, down 34%.
Sudden volatility is the enemy of leveraged ETFs whether it is moving up or moving down and last week it seemed to do both at the same time.
The pricing of options that give us the high leverage is a source of the uncertainty, but they also provide the rewards in the long run.
We have been looking at changing the make-up of our groups more often than every month recently and there is not a lot of difference based on recent tests.
It always becomes a judgement call as to future performance versus history and the state of the VIX Volatility Index is probably the most difficult to predict.
As mentioned earlier, the steady return to average annual levels of volatility has been a good time for leveraged ETFs based on our results.
Is China a Good Investment?
That seems like the wrong question with all the recent news but YES, for our algorithms.
Since March 1 in our current groups, China (Yang), has made a 32% profit which equals 155% annual return so far.
Prior to March, it was looking like China might not make the grade for a while but then it comes to life.
This is part of my reasoning to move from suggesting a minimum of 3 to 5 pairs to my new recommendation to follow a minimum of 5 to 7 pairs with this method.
Probably due to a limited number of 100% inversely correlated pairs to choose from, I have started to take more interest in the 20 Best Pairs group because the results go up in a straighter line.
Following 20 means that 15 might be the average positions and there are few days when they are all red. Last week may be one of the exceptions due to the day-by-day and up-and-down volatility but I like to see some green as often as possible.
If I were investing $15,000 and remembering my age, I would rather have 15 positions with $1,000 than 3 positions with $5,000.
I am pleased to see we get back into China tomorrow with the hope that we can make some more profit � (to help pay for those tariffs).
We are getting out of EDC and SOXS tomorrow and that seems to make sense today. We have made less profit with them than with China over the same period. Not so with their partners EDZ and SOXL, which are giving China a run for the money.
12 of 20 ETF Pairs Switching Today.
One day down and one day up is not the best climate for most investors.
In fact, we had 3 of those in succession and only 1 day of rest in between.
Trends of 1 day are not the ideal scenario for serving up signals for success, especially when we do our buying and selling tomorrow.
Fortunately, this is an unusual set of market conditions and not good for new subscribers this month. On top of the rapid-fire signals, the markets have been heading down, when pundits expect a continuation of satisfactory trends.
We console ourselves by reviewing our group charts that are generally pointing up, and with signals that mostly depend on longer than 1-day trends.
We used to have a group of non-leveraged ETFs that were based on professionally selected portfolios and they perform much better without this erratic leverage.
Maybe we should add them back to our group offerings?
ETF Trading Today.
We see a switch mostly to the bearish side in signals for tomorrow�s open and here�s a reminder how these pairs work.
1. ETF�s are �Exchange Traded Funds� and ETF Pairs include a Bullish side and a Bearish side but they all trade like common stocks on major Exchanges.
2. Inverse Pairs have a Bullish symbol and a Bearish symbol that move equally in opposite directions during normal daily market trading.
3. There are 26 ETF Pairs with 52 individual ETFs that meet our daily high-volume requirements.
4. Each day, 26 sides of these 52 ETF Pairs will go up and their 26 partner ETFs will go down by the same but opposite percentage.
5. Some ETFs have leveraged versions with different symbols that multiply the daily movement by 2x or 3x.
6. We mostly trade the 3x leveraged versions, which are re-balanced every night to maintain their published daily leveraged value for the next trading day.
7. Leveraged ETFs have daily maintenance costs and are not suitable for long-term investing. Our average trade is less than 10 days.
8. ETFs are more recent assets that are replacing Mutual Funds. They have lower annual management costs in the range of 0.25% for non-leveraged Index related ETFs.
9. ETFs mostly represent Indexes, Commodities, Currencies, Bonds, Countries, Technology and unique Sectors.
10. Some ETFs have Options available.
11. ETFs generally have a perpetual life, but some have fixed multi-year renewable dates.
12. ETFs are often more tax-efficient than Mutual Funds because they are traded like stocks on multiple major exchanges.
13. ETFs are traded through normal Broker and Dealer networks.
14. The S&P 500 Index was a forerunner ETF in 1993 with the symbol �SPY� and is widely traded in huge daily volumes. Most ETFs began within the last 10 years.
Why Change to 20 Pairs from 26 Pairs?
We often refer to the fact that there are only about 26 useful inverse correlated pairs for us to use with algorithms.
This has more to do with current volumes rather than anything else.
We don�t want to offer signals for the market opening price when it could be significantly affected due to low volumes at the open.
This same reason is why we went down to 20 pairs instead of the original 26 pairs but also has to do with individual performances in order to help the overall profit picture.
From current group results since March 1, we have determined that by eliminating those 6 pairs, the 20 Best ETF Pairs group has produced about 9% of extra profits.
This confirms the general results of our three groups. They tend to provide more profit as we reduce the number of pairs in each group. It must also be noted that volatility and daily risk increases as we reduce pairs in each group.
We plan on continuing these same groups in future as it helps overall results and gives us the opportunity to fine tune as we go forward.
Adding and removing a few pairs each month to maintain the 20 pair maximum will most likely be based on seasonality or current performance.
The approximate 15% annual growth of inverse pairs gives us good reason to think there will be more to choose from in future years.
A final note of interest.
The Dow and the S&P 500 along with other indexes, had �outside days� today which is often a positive signal. Let�s hope we get out of this recent negativity and volatility.
Let�s Look at Some Ratios Again.
Most of our charts include a graph with a line showing the S&P 500 progress over the same time period as our current signals and subscribers.
Difficult to compare but as I look at the 4X chart now, the S&P is up 3% in 69 days since March 1 and our average of all 3 groups is up 27% with an annual projected increase of 141%.
You can see that our groups of 5 Best, 10 Best and 20 Best, are all well above this S&P index that represents about 40% of the world stock capitalization.
This needs some different comparisons!
While these numbers are great, we provide much better numbers to compare results on the lower part of the same 4X chart.
I have added the 3 groups together for convenience and from the current live chart, the 3 trade ratios are (2.7 + 1.9 + 2.0) / 3 = an average of 2.17 wins for every single loss. That equals about 68% are winning trades and 32% are losses.
The other ratios we watch are the dollars won or lost on each trade. Again, from the current live 4X chart, the 3 dollar-value ratios are (4.6 + 4.3 + 3.7) / 3 = an average of $4.22 of profits for every $1.00 of loss.
Clearly, each group is profitable and the fewer Best Pairs selected for your portfolio, produces higher historical gains with higher proportional annual gains and volatility. There are short periods of losses but historically, the steady profits have been well above the S&P list of world-wide stocks.
Another way of looking at the ratios would be to multiply the wins together. Then the result is historically 2.17 x $4.22 = $9.20 for every $1.00 of loss since March1.
A final important number to be found on the 4X chart is the brokerage commission cost for all our trades at Interactive Brokers. Here I see a total of $464 which represents less than 6% of the $8,256 profits over this same period for all 3 groups.
I am not a salesman for this Broker, but they do a good international job for our accounts for $1.00 commission on each trade of less than 501 shares. Additional trades are required for more than 500 shares.
Click here to see all 20 Best ETF Pairs details.
20 Best ETF Pairs is Best Place to Look.
If you click on the link to �20 Best ETF Pairs 3x� in the left side of the website, you will find the 3B chart that now includes �Gains Since March 1�, as well as Wins and Losses for each ETF.
This information used to be on the old 1A chart but is part of the 3B database.
Subscribers receive a link to all the past week�s signals with their daily new signal information each evening. This is also helpful if previous signals are needed for further reference.
This simplified way to receive signals includes all Buys and Sells each evening.
We have reduced our daily reporting on 6 inverse pairs and are only now reporting on 20 pairs that show some current performance.
The other 6 will always be available for inclusion if current circumstances show some positive potential and could reappear in future months.
By adding a new group of 20 Pairs this month, it becomes a very profitable source for followers who prefer less volatility in the daily value of their account. This can be seen from the graphs of the 5, 10 and 20 pairs which become smoother as we select a wider range of ETFs to follow.
The 3x leverage of this group of ETFs does occasionally show itself on volatile days, especially if the Energy pairs are well represented in a portfolio. On the other hand, a larger number of leveraged ETFs tends to spread the daily ups and downs into smoother if lower profitability.
No Blog Today.
Traveling today but charts are all up to date and doing well considering the market conditions.
Dow Tanks and We Make Profits?
Trade wars threatened by a tweet over the weekend and the Dow responded with a large drop in value. Not for us!
These are the days that Brokers warn us about when we place orders for the market opening price. Who decides on that price?
Obviously, we studied this phenomenon and our algorithms are all based on historical recorded facts.
Today, with 4 Buys and 1 Sell, we made almost $600 extra profit at the open. This in a �Best 20 Pairs� account that averages $3,858 per ETF trade.
On 4 of our 5 trades today, the prices were better than recorded history because this unusual day produced lower opening prices for our account with Interactive Brokers. Lower than eSignal and the financial press recorded as the average opening price.
We all get slightly different prices at the market open, due to the arbitrage spreads between the bid and ask price each day. Usually a penny or so.
With a day like today, when fear affects the markets, their can be much wider spreads and it affects where each Broker fills their orders.
Of course, this can be in the opposite direction, but in the long run, those variations are built into our program and results.
We watch these prices closely for our algorithms as well as for our own accounts, but we use the reported opening prices in the charts and graphs that we publish every day from eSignal.
Your own fills are important to you and we see small differences between Tradier and Interactive where we hold our own accounts. It is true that placing orders at a market price gives away the opportunity for poor fills on any order.
However, we only recommend ETFs with enough volume that their opening prices are the result of arbitrage between many buyers and many sellers.
We can use this daily opening price with a degree of confidence because it avoids having to watch the markets all day long and then having to decide what time to place your orders. This is a significant benefit to our subscribers.
Energy is Our Largest ETF Sector.
In all 52 inverse pairs that meet our requirements, the Energy sector is the largest with 6 bullish and 6 bearish ETFs.
This represents 23% of the total but also represents 36% of current profits that our algorithms generate from them.
In comparison, the S&P 500 related ETFs number a total of 8, or 15% of the ETFs but only account for 11% of current profits.
Why do we care?
The perceived risk of having so many Energy ETFs, is balanced by the following actual signals.
We have pre-published signals and results over the past 3 years. They show that our algorithms can quickly gain access to current trends, no matter which direction the markets are going.
The risk is how many days are involved in turnarounds versus total upside or downside trends. Looking into the future, this is an impossible calculation and that is where 3 years of history tells the only relevant story.
We discussed this history yesterday with the daily 4X chart seen on the Blog and the numbers appearing at the bottom of that chart. It relates to comparing winning versus losing ratios as well as profit ratios.
But the risk is also having 23% of available inversely correlated ETFs in a common sector and industry!
This risk is answered by 5 of the 6 available pairs being in our current �20 Best Pairs� group and the 36% contribution to profits versus 11% from the S&P 500 sector.
Finally, medium-term risk is uniquely limited with inversely correlated pairs because we will quickly send out signals and change directions, whether the markets decide to go up or down and our average trade is for less than 10 days.
Note - Check out the replacement daily signal chart for subscribers below in last Wednesday's blog. Easy to follow and complete data will still be available and linked to the subscriber page.
2.5:1 Trade Ratio & 6:1 Profit Ratio.
Chart 4X gives a lot of information about trades in all current group trading since March 1, 2019.
For example, at the bottom of the chart there are numbers of winning and losing trades. By adding them together you have about 2.5 wins for each loss.
By adding the dollar amounts together you have about 6 dollars of profit for every dollar we lose.
This analysis stays quite constant and is a combination of the gain and speed of our algorithms, plus doubling the profit using 3x leveraged ETFs.
Volatility timing and market direction are the main ingredients that affect these ratios and today was a good example of selling 3 different Energy sector ETFs on the same day.
These sectors with multiple ETFs can affect the daily ups and downs but it also demonstrates that we don�t stay with positions very long, no matter which direction they may be going at the time.
Further evidence that we look for tomorrow�s direction every day and are quick to find trends.
Probably a good time to mention again: - I would rather invest in 10 ETFs with $1,000 each than 5 ETFs with $2,000 each. It�s simply a question of spreading your positions among fast moving assets.
Trying a New Tack.
Sorry for the attempts at improvement but � there is always a better way!
I have attached a new chart that some of you have seen before or at least similar versions of it before.
It is true that only a few investors are looking at �100% inversely correlated and leveraged ETFs�. It is more like professionals to be fully aware of these opportunities.
It is also true that we are quite early in covering this subject and are trying to simplify the process. Hence this new chart.
The original daily chart 1A to every subscriber, includes a lot of information that isn�t needed to make the indicated trades when signaled.
To try to make all that data available but also to save time and complications with distributing the signals, this new chart 1B tells you all you need to know when trades are suggested.
Depending on which group you are following, you can easily see which new trades of ETFs are for tomorrow�s market opening.
Today�s example is a simple chart with only 1 trade indicated in only 2 of our established groups but it is easier to see which trades should be made no matter what your portfolio includes.
The total information will still be available to anyone needing it, by clicking the link that will take you to the backup subscriber�s page.
Staying Flexible With Rolling History.
The advantage using 20 pairs in the new May groups gives us a way of leaving low-performing pairs out and use only the best 5, 10 and now 20 Pairs.
Another advantage is adding the current profit from each individual ETF to help you staying flexible with your portfolio.
For example, when you receive a Sell signal, you can consider any of the good performing ETFs to replace the vacancy in your account.
We always follow all available 26 pairs, but natural cycling of sectors occurs as they move into or out of favor.
Using Interactive Brokers at $1.00 trade commission, makes a nice difference for those of you who prefer following the Best 20 Pairs group for a smoother performance.
20 Pairs may seem excessive but due to duplicate sectors such as Energy, S&P Stocks and Precious Metals being among these pairs, you are staying within a dozen or so investment sectors.
Of course, you will rarely have a full 20 count in your portfolio, but you now have the tools to fill in the gaps if you so choose, by using the currently higher performing ETFs.
We have often begun past groups with new start-dates for profitability reasons, mostly to demonstrate performance but also for convenience when we wanted to add new programs. The algorithms have changed very little but their ability to work across a range of different assets brought new interested followers.
Being flexible by staying with the higher current performers is our advice and we are testing ideas that may be of interest.
We are following a rolling period of current performance in order to maintain continuity. We do this by adding today and deleting the oldest day which keeps the rolling number of trading days to a constant number.
Current Groups of Algorithms Doing OK.
Even though we continue to follow all suitable inverse pairs of ETFs, there are a few that do not currently meet our needs.
An additional reason for us to add a group of 20 ETFs to our investment groups is that some pairs are not worth including based on current performance.
We mentioned that we now prefer a minimum of 5 ETFs in any portfolio, rather than our previous minimum of 3.
This is also why we reduced our initial investment to $1,000 from $2,000 in all our ETF trading records.
Due to the short-term of our average trade being less than 10 days, it is also clear that we don�t need to switch our investments in these pairs. It is not necessary to treat them as a pair that we must switch from the bullish side to the bearish side and back again.
While we choose and invest in them as matching pairs, followers do not need to stay with both sides of any pair after their initial investment.
It is better to look at current performance of the bullish or bearish side of any pair as a single investment, rather than staying with that pair.
Recall that we used to stay with a select group of ETFs that represented a professionally chosen portfolio selection, but experience tells us to go with the ETFs that offer the best current profits.
Most inverse ETF pairs do not perform equally in their bullish and bearish format.
It is better to look at each side of all pairs as individual investments and let the general market direction tell us which side to be in at any time.
Putting our Best Foot Forward.
Followers know that we have offered stocks and balanced professional portfolios of ETFs in the past.
To take full advantage of our algorithms and signals in May, we are offering the best suggestions from ourselves as well as from our followers.
Our first suggestion benefits everyone and is a simple switch to Interactive Brokers as your new Broker/Dealer.
$1.00 trades with a highly professional online website are difficult to beat. We maintain accounts with them and are very happy with their service.
For the record, we have no relationships with Interactive or Tradier where we also have accounts. Tradier offers $3.49 trades and a good and simple easy-to-operate site.
Due to Interactive being the more sophisticated world-wide site, there are a few bells and whistles to get used to.
The main one is to use the drop-down menus for �Order Type� to specify our trades as MKT (Market Orders) and the �TIF� drop-down menu to specify OPG (Opening Price). You will get lots of messages warning about using Market prices, but warnings can be turned off when you feel comfortable. The reason we have daily ETF volume requirements is partly to ensure fair prices and lower bid/ask spreads.
Secondly, we are reducing our own trades to $1,000 per ETF, instead of the $2,000 that we always used in the past. We now round off the shares we buy to this lower value. This means that any account should be funded with about $1,000 minimum for each ETF to be followed.
We recommend opening a Margin account to avoid problems with the required 2-Day Banking rules. This way, you would only use the credit for 1 or 2 days if recent sales do not credit your account soon enough.
For today, it would be a good idea to look at our actual trade charts since March 2019 and especially the graphs above them. We have also improved the daily 4X chart with the Blog, showing the various group performances. Added to the bottom of the 4X chart are critical statistics showing wins and losses and ratios for each group.
You know that only 26 pairs meet our volume requirements today and starting in May, we are offering Best 20 Pairs along with the Best 5 Pairs and Best 10 Pairs.
Why are we doing that?
Remember that bullish and bearish sides of each pair are considered separately and independently from each other. You may or may not switch sides of any given pair because they have different performance rankings.
The more pairs that you follow, you will see from the graphs that you get a straighter line of success. Remember that you never get a signal to buy both sides of a pair. Therefore, I prefer to follow 10 ETFs with $1,000 dollars each rather than 5 ETFs with $2,000. The graph will be straighter, bringing the day-to-day risk down although net profits will be lower.
See Chart 4X each evening for actual current trading performances.
Finally, the 1A chart that Subscribers receive (see sample), lists both sides of each pair but sorts them by individual ETF performances. It ignores whether they are the bullish side or bearish side of these inversely correlated pairs. Note all bullish ETFs have a white background.
You will see whether the highest rankings are mostly bullish or bearish and you also have the 4 Index signals to review at the bottom of the chart.
We also suggest that any stocks remaining from earlier months should be sold and replaced with ETFs having the �T� first day Buy Signal and high rankings.
Improved Pairs in May Groups.
There are some ETF changes as we transition into May next week with our normal monthly upgrade to the current higher performers.
You can check on the 1A chart, which ETF pairs are currently more profitable.
If you own any ETFs from previous groups, you can either replace them immediately or wait for a Sell signal.
Alternatively, you could replace them with any of the May ETFs that have better current performance. I usually like to replace them when we get a first day �T� signal with higher profitability.
I was surprised by the China pair, YINN and YANG moving into the top 10 position as it recently was a lower performer. It could be related to the import/export negotiations currently under way.
As you know, we only need movement in either direction for any pair to creep up higher in the performance ranking.
More surprises are the semiconductor ETFs, SOXL and SOXS. We have traded direction many times lately and this just goes to show that the number of trades is not necessarily a good or bad predictor of future profit.
As previously indicated, we are dropping stocks as a group in May because of the better all-round performances of ETFs. The significant reduction in risk and our ability to trade ETFs in up and down markets has given us superior results most of the time. Consider selling any stocks you have and replace them with ETFs.
Even though ETFs are new to many investors, they are traded the same as stocks and have very high volumes. This volume reduces the spread between the bid and ask prices, helping profits all year round.
May will Offer Superior Opportunities.
We may be the first and only service that you have found that offers signals for buying and selling 100% inversely correlated and leveraged ETF pairs.
Our research could not have come at a better time in history.
These specific types of ETFs are about 8 years old on average. This is when I began to research and create mathematically better buying and selling dates for market securities.
It came out of my math and computer experience and my retirement from a career of engineering and management.
Approximately 4 years ago, I changed my attention from stocks to ETFs because of their rapid growth and the variety of underlying assets being offered.
Volatility became my favorite due to its importance in defining market action and I ended up being very impressed with a now defunct VIX Index related ETF under the symbol XIV.
It had a positive roll yield and that may have been a final helping the why Credit Suisse and VelocityShares took it off the market in an overnight decision that rocked the markets.
It also had an inverse relationship to the VIX Volatility Index and quickly became a high-volume favorite for traders before its sudden cancellation.
Continuing in the research, the inverse nature of XIV lead us to the rising volumes of inverse and leveraged ETFs and finally to pairs of ETFs that moved in opposing directions.
We finally were in the process of further developing the algorithms when we tested superior results from a very small but very popular group of 100% inverse and leveraged ETF pairs. These were often being used in professional portfolios for hedges.
We had found over time that our algorithms could perform well with stocks and indexes, as well as these relatively new inverse ETFs and best of all, with these new 100% correlated inverse pairs.
Due to the sensitivity and consequent speed of our buy and sell signals, we were finally most impressed with the highly leveraged versions of the ETF pairs as we could easily switch direction between up and down markets. This offers the potential of being in the markets for 365 days a year.
The only time out of the market would be the day or so of indecision when they are close to a reversal or during flat periods when movements are small or out of the news cycle. Long-term ownership is not recommended for this type of asset due to their daily re-balancing costs.
However, that is when performance between this small and unique sector of inverse ETF pairs can all be compared with each other. Switching to the more productive pairs can be introduced at certain times.
On the Road Today.
Travelling today but charts are up to date and fortunately no trades required.
How to Invest in 100% Inverse ETF Pairs.
Following is a brief explanation of the ETFs that we trade. We offer signals to trading opportunities in these unique high-volume ETFs.
1. ETF Pairs are Exchange Traded Funds that trade like common stocks on major Exchanges.
2. Inverse Pairs have a Bullish ETF symbol and a Bearish ETF symbol which move in opposite directions based on the same underlying assets.
3. There are 26 Pairs with 52 individual ETFs that meet our daily high-volume requirements.
4. Each day, 26 of the ETFs will go up and their 26 partner ETFs will go down by equal percentages.
5. Some ETFs have leveraged versions with different symbols that multiply the movement by 2x or 3x.
6. We trade mostly the 3x leveraged versions of these ETFs, which are re-balanced every night to maintain their published leverage value. They have daily maintenance costs and leveraged versions are not suitable for long-term investing.
7. ETFs are the latest asset replacing Mutual Funds. They have lower annual management costs in the range of 0.25% annually for non-leveraged Index related ETFs.
8. ETFs mostly represent Indexes, Commodities, Currencies, Bonds Countries, Technology or other unique Sectors.
9. Some ETFs have Options available.
10. ETFs generally have a perpetual life basis, but some have fixed multi-year renewal dates.
11. ETFs are often more tax-efficient than Mutual Funds because they are traded like stocks on multiple major exchanges.
12. ETFs are traded through the normal Broker-Dealer networks.
13. The S&P 500 Index was the early forerunner of ETFs with the symbol SPY and is widely traded in huge daily volumes. Most ETFs began within the last 10 years.
We Constantly Seek the Best Pairs.
Markets were closed today.
We need to change one or two pairs each month (as necessary) because all ETFs move in different cycles.
Just like stocks, they move differently but when you add a group of stocks together in an ETF, you essentially have the moving average of the selection.
The S&P 500 Index provides the moving average of all 500 components just as the Dow Jones Industrial Index provides the moving average of 30 components.
A sector of �Emerging Market� stocks has a smoother moving average than each individual component.
We recently mentioned that there are only about 26 ETF pairs with inverse correlation, that also have large daily volume for us to trade.
Your first advantage is these 26 inverse pairs represent most of the world�s major Index and Sector investments and can be found in major portfolios.
The second advantage is that 26 sides of each pair go up and the opposite 26 sides go down. We can choose which side will potentially go up and our algorithms tell you which side will most likely go up tomorrow.
You will then receive a buy signal, even though the net combined gain from both sides will be zero every day. Each ETF receives a Buy or a Sell signal for tomorrow.
Also, by following all 26 pairs, we have a good opportunity to see the entire world of investing at any given time. Next month will be different to this month and we project the best ETF pairs as well as the best side of the pair to buy.
A portfolio of 5 to 10 ETFs from any current month will represent a good range of ETF indexes and sectors projected for that month and all buy and sell signals include current up-to-date profit percentages.
An example of differences in some selections is when stock prices go up, volatility and bonds go down; not all the time but a general rule.
As we can profit in either direction, we don�t mind if an index or sector is going up or down. This gives us 365 days of potential profit each year from each pair and we switch pairs depending on their current monthly potential profit cycle.
For these and other reasons, we run assets every day to maintain harmony between our mathematical algorithm projections and current trends. Both sides of all pairs are run independently. Sometimes we make a recommendation for the sale of both sides of a pair, but we never recommend buying both sides. This means whatever number of pairs you choose to follow; you will never receive more buys than your chosen quantity.
We have a good historical record of getting in and out of ETF cycles in an average of less than 10 days, but we also recognize that we must recommend small changes in the selection each month if required.
Naturally, a great advantage is the ability to trade in both directions of a complete investment universe.
Also, having reduced our investment world into 26 bullish ETFs plus 26 bearish ETFs, (52 different ETFs) we are able to multiply profits by trading 3x leveraged versions of these 26 pairs. The short-term trades make this possible.
Consistency in Our Graphs and Charts.
A good chart goes from bottom-left to top-right and is often denoted in a greenish color.
We do this also, but we like to put a red line on the same chart to show what the S&P 500 Index is doing over the same time period.
Last October volatility and markets went crazy, but we were still going up, while the S&P was going down.
More recently they have both been going up, but we go up faster. Why do we always go up no matter which direction the S&P goes?
When markets are going down, our algorithms quickly point us towards buying the bearish side of ETF inverse pairs and selling the bullish sides. The net result is we are invested in the side that is currently making profits.
We sometimes end up in the wrong side for a given day but the speed at which the changes in direction are recognized is the great benefit of the process.
Trends and directions are constantly changing for lots of positive and negative reasons. A look at the graph of any asset shows the zig-zag pattern of either a steady up move or down trend and we catch them early in the changes.
With early recognition of these reversals, we are always moving into a positive investment climate as soon as we can. You can see that we sometimes are too early with a decision, but we are always ready to take advantage of a short or longer-term move.
Inversely correlated pairs are perfectly matched to our algorithms because we profit no matter whether markets are going up or down.
Leveraged pairs give us an extra boost precisely due to quick recognition of trend changes. It�s somewhat like switching between put and call options except you don�t have the rapid time-value losses and are owning an asset more like a Mutual Fund of underlying assets.
Inverse Pairs Avoid Risk.
Possibly the greatest benefit from our algorithms and 100% inverse ETF pairs is they profit from up and down markets.
Saying that another way, if you choose a stock, you will lose when it moves down.
We don�t have that problem!
Our algorithms only look at tomorrow and decide which direction an asset is most likely going. Then we repeat the same mathematical process every day.
Because 100% inverse ETF pairs have a bullish side and a bearish side, we simply invest in the most likely direction for tomorrow and repeat it every day.
This fact alone eliminates most of the short to long-term risk because 75% of our trades are less than 9 days and take great advantage of those short-term trends. Most trades (57%) are currently less than a week but we stay in longer with profitable movements and trends.
The speed and accuracy of our algorithms is such that they can take advantage of highly leveraged ETFs with 3x the movement of their underlying sectors or indexes.
Even though 3x leverage offers 300% profit over the underlying asset, the management cost is very high. However, we have averaged well over 200% of that 300% or 2/3 of the profit through the speed and accuracy of our signals.
We know that risk is important to every investor and that was my reason 8 years ago to start developing these short-term algorithms.
The main take away is that we only concentrate on tomorrow and we repeat the calculations every day. By doing this, we have developed a record of being correct with our pre-trade publication of signals for the last 3 years. You can easily check this record from the Historical Data page or better still, try our 30-day Free Trial.
In 30 days, you can get used to the signals and paper trade your way to similar profits. You can check for yourself what annual return you can make.
By the way, we have no relationship with Interactive Brokers, other than some trading accounts, but we recommend them with their 1.00 commissions per trade.
EVERY Day, 26 go UP and 26 go DOWN.
The main fact about 100% Inversely Correlated Pairs is one half always goes up and the other half always goes down.
We run 26 inverse pairs every day to decide which way each side will go.
One side of them will go up by �x%� and the other side will always go down by the same �x%�.
The Buy and Sell price-spread might differ by a penny or two but they always operate this same way.
So, our algorithms will tell you the signal changes and which side of the pair is most likely to go up.
Sounds easy when all you do is pick up or down.
It�s like choosing Red or Black in Las Vegas with the help of our algorithms to know which color comes up every time. I used to be a card-counter before they introduced those darn shuffling machines.
I have been a numbers person since a young boy at Coundon Primary School in Coventry. In those days we had a class called Mental Arithmetic, but it seems to have gone out of favor today.
Back to algorithms, we have developed ways to improve the odds from 50:50, and they are much more often right than wrong. We keep running them every day and send you the answers each evening. You can have our 30-day Free-Trial to check them out yourself.
The best day to buy or sell is the first day of a signal change when we tell you to buy or sell. You just place your orders for tomorrow�s opening price. Your average trade is less than 9 days and often less than a few days. It is that simple.
Our first-day-signals have a �T� by them and you just keep buying and selling the �T� signals whenever they occur. We think somewhere between 5 and 10 positions is a good quantity and $1,000 is a good minimum for each position. We always use $2,000 to start each position so that followers can compare our history going back 3 years of pre-published signals.
You can just sign up for our 30-Day Free Trial and check out how easy it is to follow them.
Conclusions to Assist � Part 2.
We introduced VIX Volatility Index related pairs into our groups, even though they do not have the 3x leverage that we can typically work with.
What they do have is a tendency to be a good hedge because they generally move in opposite directions to the stock markets.
They do also tend to move up very fast which isn�t the easiest trend to catch.
However, they move back down more slowly and more profitably but can often bump around their low to middle price range for long periods.
The net result is the availability of good profits, but they are limited to fewer days than other inverse pairs that we like to trade.
Stocks are another asset type that works well with our algorithms, but they have their own range of considerations. As part of an Index or sector, they perform well but as individuals, they can present sudden direction changes which again, isn�t the easiest trend to catch.
They also do not have the individual inverse direction to work with unless you introduce options trading or indexes.
The main difficulty with stocks is that someone needs to be a stock-picker of considerable talent. We would need to select those that offer good future upward movement and once again, that is not the best use of our algorithms.
You only need to look at our 4X Chart each evening to see where my conclusions are going.
100% Inversely Correlated ETF Pairs are the #1 profitable use for our algorithms.
They have been developed at exactly the right time as the ETF market has become the newest and most widely accepted new investment choice for investor portfolios.
Our initial goals pointed in this direction although ETFs were not fully developed at the time but results today have become unique and profitable.
We are putting our efforts into this best use of our product and will include volatility pairs in our selections when indicated.
The mechanics of our algorithms and selection process does not favor stocks versus inverse ETF pairs. We expect to concentrate on our best product, especially for our followers as well as for ourselves.
Conclusions to Assist Everyone.
Eight years ago, my interest was to help my own investing by improving my own timing when buying and selling assets.
After all, I had a career producing and designing products, using computers wherever they could be most effective.
In recent days as well as last year, I spent a lot of time rounding out a product line to help all types of additional investors who mostly invest in stocks and a few who invest in ETFs.
I now have a different conclusion which tells me to offer the most efficient and most productive system that we have.
Readers of recent blog posts and from earlier days, already know that the best product we have for short, medium and long-term investors, is a set of algorithms that trade 100% inversely correlated ETF pairs.
As a mathematical stock-picker, I can find stocks that work well with our algorithms, but I would have to be an expert stock-picker to maintain a performance that could compete with inverse ETFs.
So, here is my idea of our best product.
We made an early decision with ETF pairs to exclude buy signals that would occasionally indicate buying both sides of any inversely correlated pair. This did rarely happen because markets have occasional biases and very small profits could be projected even though they would rarely be realized.
We do get signals to sell both sides of pairs and we prefer to lump 2 buys and 2 sells in the same bucket as the algorithms are basically undecided and not worth any investment.
There is a trading benefit to this decision which limits your investments to how many pairs you choose to follow. This avoids any need to quickly have available funds for that extra purchase.
It also means that as a cash investor using a margin account, you will never need more than your full cash value. The only exception could be when you buy your final ETF on the same day you sell an ETF, and margin money may be needed for one or two days to meet the 2-Day Banking rule.
It should be noted that the 3x leveraged ETFs that we recommend are treated in a similar way to options trades and get less favorable margin treatment. However, I can report that Interactive Brokers seems to have a more friendly set of margin rules, based on my own experiences.
More on this tomorrow. . .
The Facts That Matter to Me.
We often review the ETF or Exchange Traded Fund markets and in 2017, there were 1832 ETFs with $3.4 Trillion assets.
This represents 72% of the total world value of ETF assets available. See chart.
ETFs have lower management costs than similar Mutual Funds and have a wide variety of indexes and sectors to choose from.
A recent 20-year study by Andrew Sather for 1996-2016 found that the S&P 500 went up 53.3% of the days and went down for 46.7% of the days. The net value went up by 7.9% per year.
This is close to the 8% often quoted but it is interesting that he found on the down days, the average loss was 0.87% and the up days averaged only 0.82%.
This is the type of data that convinced me to develop a mathematical system that could decide which direction the markets might go tomorrow. The result would be that anything better than a 50/50 result would increase his 7.9% annual profit.
We could make it work on indexes and similar concepts would also work for individual stocks and their derivatives.
Now skipping a few years, we found that ETFs had a better growing range of assets that have features that offered further improvements.
This is the concept that we followed. If you improve buying assets on those days that go up, you could only improve those 53.3% of the available market days and sit with cash on the 46.7% of down days.
Fortunately, ETFs are now available that move 100% in the opposite direction to their underlying investment. Finally, they are available in pairs, so they move every day in exactly opposite directions.
The result is that we put our algorithms in reverse gear and can now invest and potentially make profits in the 46.7% of the days that the underlying assets are going down.
So here is the math. Supposing we could double the 7.9% annual move of the S&P 500 during the up-days, we could also potentially double it again by investing in the opposite side of the ETF on the downside.
So, we make 7.9% x 2 on the upside and due to trading both directions, we now make 7.9% x 2 x 2 or 31.6% trading both sides.
From chart 4X at the top of this page today, we are currently making an average of 15% to date or an average annual return of 85%, all since February 4 this year.
Short-Term Trades = Long-Term Profits.
We try to blog subjects that better help new as well as current followers.
It seems repetitive to long term readers, but new followers often ask about the benefits of inverse pairs trading.
All 100% inversely correlated pairs have one side designed to go up while the opposite side is designed to go down.
Traditional methods of trading in both directions involve buying a stock to benefit from its upward movement. However, to benefit from the downward movement, it is necessary to borrow someone else�s stock and sell it �short�.
Unfortunately, borrowing stock is not always available at the time necessary to meet the requirements of investors.
A riskier but always available method to trade both directions is to buy �Call Options� for expected bullish moves or buy �Put Options� for expected Bearish moves.
ETFs or Exchange Traded Funds have combined these procedures into a simpler asset, that can represent a wider variety of assets or sectors that you may be interested in trading.
ETFs are usually cheaper than Mutual Funds for investors in terms of management costs, except for leveraged versions of the same ETFs that need to replace stocks with a variety of options to gain their published leverage. To maintain the published leverage, the ETF is re-balanced every night before the next market opening and added management cost is required to do this.
The result is that if �ABC Bull� goes up 3% today, its partner �ABC Bear� will go down 3% today. Our algorithms are designed to decide in which direction they are most likely to move tomorrow, and they repeat the same calculations every day.
We signal any changes to subscribers every evening for trading at tomorrow�s opening price.
One of the unique aspects of our algorithms is that we remain in trades for an average of less than 10 days. This allows us to trade 3x leveraged versions of the ETFs because the normally high management cost is overcome by the short span of days that we own them.
Importantly, the large reduction in risk is realized by trading equally in either direction throughout the year and not being limited to upward and bullish markets.
A review of our History Data page shows all trades for the past 3 years. While we are not correct every day, these graphs and complete trade history demonstrate steady and profitable results.
Future Thoughts and Trends.
I have often spoken about the limited number of 100% inversely correlated pairs but the volumes and world-wide interest in them is huge.
They are rapidly becoming extremely popular instruments for large portfolios, including the pairs that we trade.
One of the consistent factors that we find is that the largest ETFs are often representing Indexes and large Sectors and are often the more profitable inverse pairs that we analyze.
This makes good sense because large portfolios need large places to invest.
This also plays into the direction that we find ourselves following because large index-type ETFs tend to have cleaner reversals than small sectors or single stocks. It takes more money and broad news items to turn them around.
So, we expect to see our pairs being more representative of indexes and larger sectors in the future.
This same phenomenon is playing out in single stocks and volatility ETFs, where cycles and trends are more independent and cause them to move up and down in the profitability column.
We have talked about VIX Index related ETFs that have quick upward moves but often have longer more profitable downward trends.
We see similar effects with single stocks except in reverse. They tend to have slower climbs to success but then have sudden drops from earnings or surprise news announcements.
Nothing has the built-in benefits of inverse ETF pairs where we can invest in both directions.
Finally, and added to both directions, is the leverage that can be obtained, when the costs of that leverage can be overcome by average trade lengths of less than 10 days.
We have noted the above trends and the ways that they favor our unique algorithms.
Risk reduction is the ultimate benefit of trading ETFs in both directions and there is little doubt that the current higher profits from our inverse pairs trading has moved them to our highest results.
Finding the Sweet Spot for Algorithms.
Each month as we progress in choosing ETFs and stocks for our different groups, we have the benefit of more data from previous selections and their results.
Although we first started building algorithms for stocks 8 years ago, we moved to ETFs based on the VIX Volatility Index just about 3 years ago. We went public with these trading signals and had excellent results in excess of 150% annual profit.
When Credit Suisse withdrew their ETF (XIV), from the markets, we returned to a variety of ETFs and stocks again.
As we had first developed algorithms for stocks, our goal then was to improve the timing of trades by developing better Buy and Sell timing using mathematical algorithms.
Second to timing, we were able to use these algorithms to help in selecting assets that worked best in combination with them.
It turns out that the timing and trading aspects of the algorithms is very stable throughout the asset ranges and remains almost constant. However, selecting assets that work best in combination with timing, continues to produce beneficial feedback and opportunities.
Consequently, we seek to improve selections each month. A few days ago, I commented on the possibility of making changes within the month to take advantage of these opportunities.
There is a conflict between wanting to further improve our service and the needs of followers to have a more constant investment program. We will balance this conflict by planning changes carefully to not interrupt current investments.
One example of this is the inclusion of volatility-based ETF pairs in the �10 Best Inverse Pairs� because of their unique cycle. They will rise to a �10 Best� position when their current performance justifies inclusion.
We like to receive feedback from followers, and you can do this easily on the �Contact Us� page. Thanks.
Tips For Buying the Mixture Group.
Two useful ideas that we use at Roebuck Systems for anyone wanting to follow the Best 20 Mixture group.
First, we would open an account with Interactive Brokers because it is difficult to beat their commission prices at $1.00 per trade.
They do limit you to 500 shares, but you can place additional orders to go over this limit for another $1.00 each.
Second, we would recommend a Margin account because it eliminates any �cash available� situations, especially when buying mixed ETFs and Stocks.
The reason for this is that stocks usually get the 50% margin rate for available funds, whereas leveraged ETFs get less margin availability because they are treated like Options trades which have greater risk.
This is one way that a mixed portfolio becomes a benefit because you will have more available funds when some of your trades include stocks. You are only borrowing funds at the margin interest rate for 1 or 2 days. This is due to any sell trades settling in your account, assuming the Banking T+2 Day Rule.
Unfortunately, there is a negative aspect that we always must mention. 100% inverse pairs trading has a built-in risk eliminator because you would be trading in both directions.
In any rising market you are mostly into the bullish side of the pairs but at any time that markets reverse, you will be into the bearish side of those pairs. This great advantage of investing in 5 or more diversified pairs and sectors, can sustain different market conditions.
The worst enemy for inverse pairs trading is a continual series of short-term volatility days that cause rapid reversals.
One situation that can hedge this condition is one or both inverse volatility pairs would likely move up into the higher profitability range. One feature of volatility is that it tends to rise quickly and take more time to trend down.
This can be a good time to own them if you also account for the fact that market prices and volatility are almost always moving in opposite directions.
All is Well in Chicago.
Finally, all is back to working condition.
It has been a long time since we had data problems. The internet and access to it, has become another utility and we don�t like things going wrong.
Our main subject today is changing symbols in our Best 10 Stocks or Best 10 Pairs during the month rather than waiting for the next month to make any changes.
Our conclusion is that we should make changes at any time that we believe it is likely to produce better results for our subscribers.
It seems that if the symbol that we want to remove has a Sell Signal yesterday, then replacing that symbol with a new symbol that we believe would be more profitable, is always a good idea. We think everyone would prefer the new symbol.
The only bad factor would be if for some reason, a subscriber was unable to check the previous day�s signals, they could possibly still own the old symbol and would be surprised if it was missing.
We would solve that problem by adding a message to the daily email for the rest of the current month, that also reports that symbol XYZ was a sell and has now been removed and replaced by symbol ABC. This new symbol could be a Buy or a Sell at that time but is calculated to have better potential profits for the future.
The same method would be true for an Inverse Pair. This would only happen when both sides of the pair had a Sell Signal yesterday. A similar message would be added to the daily email for the rest of the current month so that everyone has received notice of the improved symbols.
We would most likely only do this during the first few weeks of any month, but I am reminded of a stock that last year had a buyout proposal early in the month and the price stuck there for a long time afterwards.
Tuesday Apr 2nd 2019
Trades are OK but Data Feed not Fixed.
We still have a data feed problem that remains unsolved, but markets closed before we could isolate the problem.
I have been an eSignal and QLink subscriber almost longer than they have been in existence and rarely have I had problems.
Unfortunately, we will be in touch again tomorrow morning to finally fix it.
The data is correct and so are all the signals that we generate. It is mainly a convenience factor now and once again; I must apologize and continue normal Blog service tomorrow.
Monday - late update Apr 1st 2019
Error Cleared Up.
We had a coding error over the weekend while getting the April algorithms prepared but have now corrected it. Signals for buying and selling were not affected.
We apologize for this interruption and normal service returns tomorrow.
Monday Apr 1st 2019
Site and data error. Back up later tonight
Thursday Mar 28th 2019
We benefit from follower comments and several have been about Indexes that we include each day to Customers.
We run both indexes through the same process that we use to generate the buy/sell signals every day after 3:00 pm Chicago time.
The S&P 500 index has an ETF run by iShares under the symbol SPY and can be traded just like any stock or ETF. We don�t recommend it because it moves at the same pace as the index, but it does tell you what 500 combined stocks may do based on our algorithms.
The problem is that combining 500 of the largest and best-known stocks into a single average movement is usually a small number. If you could select the best 50 of these 500 by using some knowledge base, you could improve your returns significantly.
The point of including it is to offer a backup suggestion on where markets may go tomorrow. It is not a guarantee and it does not aim at any sector or group of stocks.
It does represent about 40% of the value of the entire world of stocks according to �Seeking Alpha�, and that is a lot.
So, our signal is saying what the average movement of this entire universe of stocks may do tomorrow.
The VIX volatility index has no direct investment symbol except for Futures Contracts and Options on those various Contracts. It is best thought of as the �FEAR INDEX� because it is mostly affected by large amounts of fear in the world. This �FEAR� is why it usually moves opposite to the stock markets due to any broadly distributed news items.
Fear goes up faster than it comes down, but it is a good representation of fear around the world. When everyone is happy and contented, it has gone as low as 8.56 but the world recession in 2008 drove it as high as 96.40.
It has been around since 1990 and its trading range is more often between 12 and 30. It has hit below 11 for about 1/3 of those years and hit above 40 for about 1/3 of the years.
The average value has been about 20 for the entire 28 years, so if it halves down to 10 or doubles up to 40, it is very much worth looking at because it is likely to reverse directions soon.
Once again, if the S&P is bullish and the VIX is bearish, that is further indicating or confirming that FEAR is decreasing, and MARKETS may go up. The reverse is also true.
Improved April Portfolios.
We are working on the April groups and as usual there will be a few changes in the stock list and the ETF list.
Based on current profits, you will still have a choice of ETF pairs or stocks and will be able to mix them up as you prefer.
They will still be ranked in order of recent profits and we will continue to include the VIX Index and the S&P 500 Index for reference purposes.
The volatility ETFs will be included in the general mix of pairs based again on recent cycles and profits.
From Chart 4X, we now have 51 days of history for the March groups which had some large swings in annual profitability.
This same chart now lists the �Average Individual Annual Profit� considering each ETF and stock on its own merits.
This is currently running at 40% average during a 4% rise in the S&P 500 Index and is running at the low range due mainly to two recent volatility spikes and reversals.
As previously mentioned, we are returning to the original alphabetical history charts in April. You will not see huge differences except for the graphs and the Historical Data web page.
The Nearest Thing to The NEWS Index.
On March 1 this year, we blogged about �The News and The Markets�, and equated various big news items that moved the VIX Volatility Index starting early in October 2018.
Clearly, we were in increasing volatility until Christmas and declining volatility in the first quarter of this year.
During those same times, stock markets moved in the opposite direction to the VIX and this is normal day after day.
If you have a trading service available, you may be able to change charts to 24 hours and get pre-market VIX indications.
This would be one way of reviewing early VIX Index values to estimate opening market directions. This is the same as checking on market futures as reported on CNBC for the DOW and S&P, in order to estimate early market direction. These Indexes could predict a few minutes or a few hours, but they are not reliable for end-of-day prices.
I am not trying to convert anyone into day-trading but as we place all orders for the opening price of the following trading day, it could be helpful to occasionally delay a trade for 10 minutes or until you get that irrepressible feeling, or another indicator.
What we need is bigger and better computers to help us with this additional decision. Market technicians can use other skills to help themselves. We, however, always report opening prices for all trades and last prices for all continuing ownership.
The VIX Index is a useful and interesting indicator but it would be great if we could review something like the CBOE NEWS Index each day. For sure, it would become part of our algorithms.
Little Change but up $715 Today.
Not a lot to take from today�s activity other than very little movement and a decrease of a net 3 positions.
At least we had no continuation of Friday�s drop-off.
For the last several years, we always recorded our daily trade positions in alphabetical order and used the receipts from the previous sale to buy a new position in that same asset.
Recently, we changed following some requests and began listing trades in date order and always used our starting capital of $2.000 for all future trades.
This has not turned out to be the best way for us to proceed and next month, we will return to the original system of listing them in alphabetical order again.
It is a small change but does reduce the overall return because no matter whether an asset is trending positively or not, they all get the same $2,000 investment each time.
We prefer to increase the investment slightly for each trade of an upward trending asset and this method tends to benefit those upward biased assets.
From, recent history, it isn�t a huge game changer, but we like to take all the profit that we can find.
You will only see our results at the end of each month when we publish our monthly trades on the historical data page.
Thursday�s News For Investors.
Just like the talking heads on Thursday and Friday, we wanted to believe the middle-of-the road possibilities for the lack of interest rate hikes.
Investors preferred to take the safe way out and quickly get out of the markets.
Algorithms will also take the safe way out but need at least 1 day to decide and maybe 2 or 3, but they can�t take less than 1 day.
Friday was one of those days when news compounded to realize that the world economy and not just the American economy was facing dire possibilities.
With our algorithms being short-term, our corrections for these market conditions started on Thursday night with the market enthusiasm as well as all other inputs. This short-term news slowly went bad on Friday and the worst news for our algorithms would be markets reversing back up on Monday. They now have 2 days for Thursday and Friday into their decisions.
On the other hand, within a day or two, and by using 100% inverse ETFs, these same algorithms will end up following a myriad of decisions for each sector, to maintain their longer-term profitability.
Stocks, on the other hand, will just move to cash and wait for the next mini-trend going up.
We have a sense of confidence, based on 8 years of evidence, and the knowledge that these unique algorithms have no emotions. They make their best decisions on the facts and then wait 24 hours to make new decisions.
We chose to make decisions every 24 hours because most followers are not able to watch the markets every hour or every minute to react to shorter time-spans.
Trading intraday was not and is not a possibility for most investors and we also believe that 24 hours is a built-in time cycle for most news that affects market directions. Unfortunately, intraday news such as rate changes in either direction, may not be helpful in the short-term.
However, inverse ETF pairs are the best thing to happen to investors because it only takes a short time to adjust to sector direction.
It is also true that stocks are better investments when the choices are either up or cash, for the longer-term.
Adding Some Color to Yesterday.
I mentioned yesterday that interest rates were not increased by the Fed.
Also, according to various comments, it seems that interest rates may not change for the rest of the year and this produces some other significant possibilities for the future.
The markets took a positive view today and produced significant upside moves but the news on interest rates tells many different stories.
The longer-term effect could be negative as the economy is expected to cool for the balance of this year.
Cooling and leveling off would still be positive for the markets but could also threaten them for near as well as longer term. I am reminded of the saying that �Markets like to climb a wall of worry�.
This is where we see the greatest benefit to our unique approach to portfolios that can adjust to market conditions almost automatically. Yesterday, I commented on their hedging ability with the inclusion of 2 VIX Index related and 18 Sector related inverse pairs of ETFs.
Volatility usually trades in the opposite direction to general market prices but with limited leverage, it still provides a degree of hedging.
However, our sector pairs are mostly 100% inversely correlated so that a buy signal can perform equally well in up or down markets. They do this by switching sides of these inversely correlated ETF pairs.
Our algorithms are designed precisely to equally perform in either direction and whenever the markets change, you can expect them to quickly switch to follow the latest trend.
You just need to follow the daily signals and make any necessary trades to stay in the best direction. Signals are designed to be followed as a �Market Opening Trade� on the next market date but should be followed soon after the change is published.
The Fed Holds the Line on Interest Rates.
At precisely 2:00 PM in New York, the Fed decided not to raise interest rates today and the Dow jumped 122 points immediately and another 54 points shortly afterwards.
But it didn�t last long. The Dow ended up 3 points higher at the close than when it began the move at 2:00 PM.
They didn�t raise rates because the economy lost some of its future promise and could have possibly hit some reality.
On the other hand, the shutdown could have taken the steam out and maybe we pick back up again next quarter.
Either way, almost every evening, we continue to describe our new way to look at a portfolio that will respond to wherever the markets go.
We added stocks back in after a brief break in January because a selection of well performing stocks can meet and sometimes beat the performance of 3x leveraged ETFs.
The problem will be if or when the markets turn down and those well performing stocks have to deal with a recession or significant correction.
Picking good stocks at that time will become very difficult and only inverse ETF pairs can easily switch sides to quickly reverse themselves and make money on the way down.
This becomes the perfect hedge for a portfolio because it makes money in both directions.
Only the 2 volatility pairs represent an imperfect and different kind of hedge because although they tend to move opposite to stocks, they don�t have the same built-in leverage. It is also true that they perform better when volatility is coming down rather than going up, so their best direction is when stocks are already going up.
Tricks and Possibilities. . . . !
I am publishing yesterday�s subscriber chart because it demonstrates some tricks that are not guarantees but are extremely helpful.
Look at the description of the top 10 ETF ‘BUYS� by rank and note that they are all bullish for today.
(blog continues below chart.)
That is 10 individual ETFs that all calculate separately that the markets are most likely going up today.
4 of them are new signals to be bought this morning.
It therefore stands to reason that their opposites have a �SELL�, but wait. . . . !
Next, look at the 2 volatility pairs and they are both on the �BUY� side. Not surprising because volatility and markets generally move in opposite directions.
Now look at the 14 stocks below and 10 out of 14 are also on the �BUY� side. This is helpful information.
Finally, look at the bottom of the chart at the indexes and note that the S&P 500 Index is also a �BUY�.
Nothing is perfect so we also must look at the VIX Volatility Index and it is also a �BUY�, which seems to say that markets may be going down and throws doubt into everything I just said.
My answer to that is the VIX Index is the most likely to predict incorrectly and this is purely based on observations. Volatility seems to be short-sighted and reacts to every rumor before it becomes news. I prefer to follow most other asset signals today.
All we must do now is wait until the markets close to see if these signals worked today. So far at lunchtime, I am looking ok.
It is now one hour before the close and we are still looking good with some improvement.
Well, it was a close call but after the markets closed, we are up a total of $337 over yesterday for all 3 groups after the 2 volatility ETFs made a loss of $68.
ETF Growth to Double in 4 Years.
While our volatility ETF pairs have fallen and our new group of stocks is doing well, sector ETF pairs have sharply risen to the top current performing group.
The strong growth of ETFs will most likely bring more specific sectors to the markets and hopefully, this will be more of the 100% inversely correlated pairs.
(blog continues below chart.)
This ETF growth is already a huge part of investment markets with management fees much lower than Mutual Funds that represent similar goals or indexes.
Leveraged ETF sectors will always have high costs due to using option contracts.
The performance of the volatility pairs may require some form of timing for best overall results but waiting for a higher VIX Index can defeat their use as a hedging investment. For hedging against downward markets, they could be considered as a permanent part of a general upwardly biased portfolio.
Inverse pairs have their own built in hedge because we trade them in opposite directions by switching from the bullish side to the bearish side. That still can be hedged with inverse volatility pairs trades but may be less significant in a portfolio of inverse pairs than one of stocks or other single upward based investments.
It can be a real benefit to mix and match inverse pairs representing different sectors, including volatility, and then adding some stocks into the group to create a unique preferred portfolio.
We are working on including a mixed portfolio in the near future and will report on these details.
How We Report These Top Assets.
Chart 4X appears every evening based on the latest results and measures the performance of all our groups compared to the S&P 500 Index.
Chart 4X also shows the average profit of our current top performing group and the current number of �Days of Trading�.
The details in each Group on chart 4X explains the available cash, costs and profits associated with each group.
Finally, we rank each group based on the same trading period results regardless of how many assets are in each group.
For example, today after 39 calendar days, we averaged 3.2 round trades per asset per month. Also, for this same period we would be charged $257 in Broker Commissions at Interactive Brokers. This represents about 4% of our profits but we do not calculate this into profits because like you, we use different Brokers, and each charge different fees.
However, we do recommend Interactive as our first choice and Tradier as our second choice based on cost and our experience with them both.
Finally, our current and annual percentage profits are shown, which are calculated as the total current profits of $6,357 on our total available cash of $68,000 for the 39 calendar days.
It should be noted that we count each pair as a single investment because we are never in both sides of any pair at the same time.
Also note, we are rarely invested in everything at the same time so that significantly less than the $68,000 is fully invested but it must be available to our various groups if needed.
On the Historical Data page of our website, you will also find every trade for each group that we made, up until the end of the previous month. We do not publish the current month trades except to subscribers every evening.
On that Historical Data page, you will also find a full history of our algorithmic trading for about 3 or more years.
As previously mentioned, there are only about 20-22 usable Inverse Pairs that meet the high volumes necessary for us to offer this service, including the 2 Volatility Pairs.
We select the 14 stocks from the 500 included in the S&P 500 Index. We do this by their recent statistical performance without consideration to their fundamental analysis.
An Update on Volatility as a Hedge.
Volatility hit its lowest point since October 8, 2018 today at 13.16.
Its lowest point ever was on November 24 in 2017 at 8.56 but it generally stays above 10 most of the time in the low range.
I point this out because there is not a lot of downside profit from here except it can oscillate in the low teens for months at a time.
The usefulness of volatility as a hedge was shown in our results over the last few months. Sustained higher values produced long enough trends to send volatility pairs to rank much higher.
Unfortunately, bumping around at the lower-end when trends are less obvious is not the best time for volatility pairs. On the other hand, leveraged pairs and stocks do much better.
That is precisely the value of a hedge that helps portfolios through periods of fear and higher volatility. These are the times when even short trends are more difficult to predict for stock values.
The definition of fear is �An unpleasant emotion caused by the threat of danger, pain, or harm�.
Uncertainty is volatility and periods of uncertainty produce the higher values that we have recently experienced for the VIX Index.
So why is volatility approaching the lows when fear still exists? We must be accustomed to the level and type of fear until another situation overtakes the news.
It is also true that our VIX related pairs do not have the leverage and cannot compete with our 3x leveraged ETFs during quieter times.
Most Bullish ETFs Up Today.
Nine of the Buy signals for ETFs last evening were bullish.
This also shows up in the S&P 500 Index which was also giving a Buy signal.
We also had a bearish signal for the VIX Volatility Index which usually goes down when markets go up.
These 2 indexes can give useful information and become more helpful when the mix of bullish and bearish ETFs matches any of your goals.
Some of these readings can play a useful part in other investment trades when taken together as indicators.
For the record, TMF/TMV for 20-year Bonds usually goes in the opposite direction to the market ETFs.
We still recommend taking our signals on the first day they appear, as it has historically been a higher percentage winning trade. The �T� is in the second column to remind followers that it is the first day of a new signal.
A correction to charts 1A and 4X appears today. We had previously taken the average returns simply by adding them together and dividing by how many groups we added.
Those math experts out there will know that the number of assets in each group is more important than how many groups.
Consequently, we are now taking the total profits from all groups and using the Total Group Investments, which is $2,000 per stock and $2,000 per ETF pair as the base.
From Chart 4X today, we have $7,007 profit divided by $68,000 available investment. We then multiply that answer by 365 days divided by 37 days of trading for these groups to arrive at 102% annualized profit.
We are rarely invested in every pair and stock, but we must have the capital available for those rare days.
Well�..Stocks are Lighting the Way!
Sometimes you just have to say that we all had a better way. Some followers also wanted the stocks back in the program and we were all correct so far!
Stocks have forged ahead in recent days to take over the number 1 position and out-performed everything else.
We know that volatility ended a strong move down and suffered a series of reversals to level out.
Sector pairs have stayed above water and have followed a more even track but stocks are the only story for today.
We are pleased to see the stocks doing well and there is significant evidence that when we chose the best 5 from a statistical search it sometimes became disappointing.
Some of our choices from recent high flyers last year turned out to be poor and sudden legal problems and earnings reversals caused some of those problems.
I think a better way to go is to select at least 7 positions in order to spread the risk. It would also be better to do this with ETF pairs as well because the trades are usually less than 10 days.
Smaller investments in more positions is generally a less risky way to go.
Average Trade Length Up to 8 Days.
Our 18 pairs have averaged nearly 7 calendar days per trade and 2 volatility pairs are 11 days since February 4.
This puts the overall pairs trade at close to 8 days, which is closer to the 9 days we recorded last year.
Stocks are currently running at 8 days this year and are performing well so far.
We are always looking for statistics that tell us something about performance, but we are always hesitant to make changes. A broad selection of market conditions just within the past year have tested our algorithms.
We have changed the selection process slightly for statistically selecting which stocks to choose by changing how many months we take into consideration. This remains purely a current recent performance decision and seems to make very small differences.
By reviewing the stocks in our program this week, they have quickly given us some good performance while markets rise.
Volatility has gone the other way and is bouncing around a more normal average. We are limited to 2 pairs and only 35 days of history, so changes are more pronounced. Where it was in the number one position for some time, it was helped greatly by the long trend downwards from Christmas.
We commented yesterday on the unusual signals for both the S&P and the VIX indexes to indicate a buy signal. Volatility lost that race today by going down, but the S&P performed as signaled.
Returns Down but ETFs Added Back.
Both the S&P 500 Index and the VIX Index are indicating a buy for Monday morning and that is unusual.
Stocks and volatility usually move in opposite directions and seeing them both indicating buys is not normal.
We agree with some follower requests that we should add back the ETF pairs that we dropped last week for March trading. We replaced 6 of the S&P and Energy pairs to introduce stocks back into the mix based on more previous comments.
This improves the mix and adds back 12 ETF algorithms and keeps all 14 stocks.
The returning ETF pairs will benefit overall returns as they belong to higher performing sectors that were kept in March and all previous groups.
Five stocks are new buys and 2 are new sells. I would like to think this is a preview of future markets, but the first week in March has not been good to us.
It appears to be all-round tough going with volatility taking a big hit. Lots of trades indicated for Monday morning based on our signals and resulting from these 5 down market days.
I was hoping to see success with the new stock group, but high performing stocks are likely to perform worse because we only trade both directions with ETFs.
News on Wednesday of the record high US trade imbalance of $891 Billion was met on Friday with a very small Payroll report for February of only 20,000 jobs. However, the recent tax bill is still benefiting stock buy-backs and earnings reports.
When You Know Bad News is Coming.
Many of you know much about investing and there is no good reason not to use what you have already learned.
We always trade and log the signals that we send out every evening, but you may have heard the same news that I heard last night and maybe wanted to use it.
While the political news has been telling us that the US trade deficits will go down, the factual news last night told us of the highest record deficit for 2018.
A deficit of $891 Billion for the year, up 12%, breaking previous records and the Dow was down 320 points very quickly.
So, we all had a lesson on tariffs with that late-in-the-day statistic, one which would surely affect the markets at the open today.
With this news in hand, you might have preferred to delay any buys to a later hour, with the plan to place the order later in the day or cancel it altogether.
Our algorithms do not listen to current news and are locked in by 4:00 PM New York time every day. In fact, we use algorithms specifically to ignore fundamental analysis.
My previous self would use any and all previous knowledge of any type and we certainly would use it as individual investors. We just cannot include it in our algorithms as they work on their own set of data, but a gain from anywhere is a gain worth having.
We do have followers whose daytime job is to follow the markets and it would not be the first time we heard that the opening price is not always the best price. It is interesting though to count the days when the opening price is lower, and the closing price ends up much higher.
We have dissected years of trading data and our approach has been to improve the buy-date and the sell-date. On average, we may be too early or too late but over time, we have arrived at much improved short-term trades.
Historical Data for Consideration.
Every trade by our algorithms that was published on previous evenings should be found on the Historical Data page.
They go back to when we first traded XIV with algorithms 3 years ago. XIV was a volatility ETF and was removed by Credit Suisse over a year ago.
(blog continues below chart.)
At the start of every month of trading, we list previous trades up until the last trade before the new month.
Of course, we do not publish all current trades except to subscribers but at least we are up-to-date on the first day of every new month.
The removal of XIV forced us to diversify and fortunately, our algorithms could be applied to any products that are traded on various markets.
For a while, we ran a series of ETF products off the London markets, but volumes were low, and buy/sell spreads were very high compared to what we are used to.
It is important to make trades on the first day following the signals that we send out. Studies from our past trades showed that the average return on those first days after a buy signal is greater than 2%.
Followers will also find that following a strict program of inverse pairs trading will involve more trades than they may previously expect. The main reason for this is switching directions and trading both of them.
We highly recommend Interactive Brokers at just $1.00 per trade to anyone, whether you follow us or not. While their site is great for professional investors, it is simple to make specific types of trades such as ours.
We also recommend Tradier Brokerage at $3.49 per trade. This is the simplest of sites and very quick and easy to use. We have no financial relationship with them, but they do offer 60 days or $200 of free trades for new accounts with the code ROEBUCK200.
Notes for Investment Junkies.
I am always surprised when I get on to eSignal and see how many times our choices bump up against some of my favorite technical indicators.
Although our algorithms are not related to them, they all somehow rely on historical data and I should not be surprised.
I have reached a degree of satisfaction with eSignal charts and basically have set up 50-day and 200-day moving averages on the price chart.
Below the chart I use MACD for a confirming indicator.
Over many years of trying to make technical analysis work for me, it eventually drove me to designing algorithms and I found more pleasure in doing that.
My problem may have been sticking to a system. There was always a new analysis to study and a new book or seminar to attend whenever my efforts proved not to be fruitful. Also, there were always people I met who seemed to thrive enough to convince me to give it a try.
Like most people, it was my second job and I certainly spent the time and the money to buy the books and attend the seminars. However, I would finally look for that next golden opportunity.
I enjoyed all of it and can see where I was probably more interested in the journey rather than the conclusion and I think that sticking to a good method would have been better in the longer term.
If I could do it all again, I would probably make the same journey, but I do know that the 2 moving averages along with MACD below them, would probably end up being my favorites.
Ranking Changes Every Day.
Our new ranking methods worked ok today, and we are hoping that it improves profits as the month goes by.
The response to more recent profits has historically performed better when it only goes back one month at a time.
We will report on this as a few months go by. Markets rarely repeat themselves, so we must rely on statistical results over time for this to be at its best.
Inverse ETFs have a limited availability, but stocks have few limits.
We hope to improve the selection of stocks to fill the 14 positions we now have. We use statistical recent results and not fundamentals in the same way that we now use a more current ranking system.
There are so many stocks available, but we tend to include only S&P 500 stocks which does include all Dow stocks and many larger issues from other indexes.
Our recent comments and charts showing the dramatic increase in volatility from October through January greatly affects our choices but there always seems to be a good supply of high recent performers.
The saying that stocks slowly climb a wall of worry has historically proved to be beneficial to us. On the other hand, recent above normal volatility helps the profitability of our VIX related pairs. This could be a future signal for followers to switch between our groups.
Volatility - The News and The Markets.
I keep coming back to the VIX Index as I find it both profitable and interesting.
The VIX chart of August 2018 until today tells a story that we all experienced.
(blog continues below chart.)
Look for the hearing of Christine Blasey Ford on October 3 on the attached chart. That was when this latest short story of the VIX Index began. It continued through early December when President H W Bush died and the G20 meeting in Argentina brought Putin and other leaders together again.
At Christmas, we saw the end of James Mattis and the start of a long shutdown.
But then, from Christmas onwards, we see the VIX pairs producing a steady profit. Just maybe, the investing public decided that the daily news was no longer surprising and should now be discounted.
The trend of the VIX was a continuous move towards normality and a return to an average daily value of approximately 14 for the year of 2018.
The Fear Index and the VIX Index are the same Index and fear becomes a normal condition if you live with it for a while.
Given time, we will surely ride the VIX Index back up again when something new comes on the 6 o�clock news. We expect to be in the other side of the volatility pairs when that happens.
Importantly, the VIX inverse pairs do not have the leverage of our other pairs and do not incur the same daily management losses that we expect from anything with a 3x leverage.
The new 1A chart for March includes 12 inverse pairs from 12 different sectors plus 2 pairs related to the VIX Volatility Index. We have also added 14 stocks with high recent price rises and all March charts reflect 30 days of our algorithms since February 4.
We have also included the VIX index and the S&P 500 Index and included our algorithmic signals for both. These can be useful indicators for some followers.
Some Information for Followers.
We are getting results from the March selections and we do need to emphasize some suggestions to follow.
Regarding ETFs, we are suggesting that followers limit investments to the top 10 for a couple of reasons.
We are including a copy our 1A chart for today so that followers see what they will receive starting on Monday next.
First, there are only 12 sectors covered by these 100% inverse pairs and any more than 12 would put you in both sides of a pair and you would be neutral or 100% hedged in that sector.
Second, the ranking would put numbers 11 and 12 at the bottom of the daily ranking performance.
The 2 volatility pairs are unique and make a good sector on their own as volatility operates differently from the general markets.
The 2 volatility pairs on their own could make a portfolio for investors seeking less trades. It could also be a hedged portion of any larger portfolio.
The 14 stocks being added in March all have good recent performance and are also individually ranked by our recent performance. They are initially chosen from recent 6-month price performance and are not chosen by any fundamental factors or other input.
Their inclusion is like our recent �Best 5 Stocks� group. A minimum of 5 and a maximum of those with a buy signal should make up a suitable selection short of any personal preferences.
Thoughts on March.
When running algorithms for March, it was apparent that there may be another one or two specific sector ETF pairs that have not performed as well as others.
The problem is that you never know ahead of time which ones to rank low before the actual results.
A good example of this is the energy sector which suddenly did extremely well on the bearish side with huge drops in the price of oil. It will probably go back up again but we cannot predict when that will happen right now.
It is also true that the ETFs associated with the S&P-500 are mostly related to a more conservative cross section of stocks whereas China could run up quickly if we eventually get out of this tariff policy now being negotiated.
There is little doubt that longer term trends can be a significant factor and much of that is expected to eventually find its way into the algorithms. The point here is our algorithms by their design, are looking at short-term trends.
Had a question about my blog yesterday regarding my intention to use a flat $2,000 for each successive trade that we will make in the same asset. To clear that up, we run several accounts and the only reason that this cropped up is we are changing our charts to be in date order rather than alphabetical order for each asset. This suggestion has been made and we will see how effective it is.
My personal habit is to divide the daily account value by the number of assets that I decide to invest in that account and use this new value for new buys as needed. The change will not affect our algorithms or the signals that they generate.
Our Maximum ETF Investment.
When we invest in the 12 inverse correlated ETF pairs, we never advise buying both sides of any pair at the same time.
Consequently, we only need capital for a maximum of twelve positions in that account if we use all the pairs.
In the past, we have listed trades in alphabetical order and used the proceeds of sales to invest in the next trade of that same asset. This has the effect of increasing our investment in the best performing ETFs.
In March we are changing that method.
We will be using the same $2,000 initial investment but will continue with $2,000 for all trades and will not accumulate profits in later trades of the same asset.
In some of our investment accounts, we act a little differently. When a buy is indicated in an account that may have a maximum of 12 assets, we divide the current whole account value by 12 and use that value to buy the next asset.
Although we do not use margin or borrowed funds for these investments, it is always useful to set up new accounts as margin accounts. This simplifies available cash for trading and solves many delays related to the T+2 days Banking Rule.
We normally used to recommend a minimum of $1,000 in each investment but our experiences with Tradier Brokerage at $3.49 and especially with Interactive Brokers at just $1.00 commission fees, we are moving our recommendation down to $750 per asset.
Strictly from a risk point of view, it is better to increase the quantity of assets rather than invest larger amounts in fewer assets. My own understanding is that once you reach 11 different assets, you are close to a good and manageable quantity and portfolio.
What to Expect in March Algorithms?
Many improvements with the reduction in duplicate inverse ETF pairs down to 14, which includes the 2 volatility pairs.
The only energy pair will be OILU/OILD and the S&P-500 pair will be SPXL/SPXS.
(blog continues below chart.)
A new addition will be 14 high performing stocks ranked on their recent performance. You will now see all ETFs and all stocks ranked every day by their individual profit performance.
We recommend limiting purchases to any of the top 10 of each group plus the top 4 volatility ETFs. All are ranked but number 1 is always the current best.
We have also run 2 Indexes through similar algorithms as useful indicators to be aware of. Day traders may find these helpful. We are returning the VIX Volatility Index and adding the S&P-500 Index at the bottom of the daily 1A chart.
I have previously indicated that due to the early signal design of our algorithms, we find that they work well with leveraged ETFs and eliminate the need to consider each inverse pair together. Consequently, when markets are rising, there will generally be more upward-biased ETFs in the top-10.
The great advantage of 100% inverse pairs will be experienced during down-markets when more downward biased ETFs will automatically be in the top-10. This allows us to profit in both directions.
Using volatility pairs has traditionally been used as a hedge in many portfolios. When the VIX Index goes up, UVXY and VXXB will also go up but when the VIX goes down, SVXY and ZIV will follow it down.
During this current high volatility period, stock picking has introduced more risk, but our volatility algorithms have produced higher profits.
We have updated the start date for calculating current profits to February 4 for our March algorithms. Volatility has trended down to a more normal range and this has encouraged us to re-introduce stocks.
Note that staying with a small quantity of stocks can increase risk due to overnight surprises such as law suits and announcements. These are rare but more dramatic with high performing assets.
Our average trade length has increased with ETFs from a recent low of 5 days and is moving back towards our historical length of about 9 days.
A Close Look at our Algorithms.
This first hot-off-the-printer back test chart tells the story of why our algorithms work for a wide range of assets and conditions.
This first stock to come off the printer today is Automatic Data Printing from the S&P 500 with the symbol ADP.
We sorted the S&P for the last 12 months for the top 40 gainers and then sorted them in alphabetical order and applied our algorithms to ADP.
The stock gained 32% on its own and we gained 62% by using our algorithms but look at the chart for how we did it.
When dealing with leveraged ETFs, we often boast at the speed that our algorithms get in and out of a trade. Not every trade, but many trades over a reasonable time period. Just look at this stock chart for ADP.
For the first 4 months it gained 20% and so did we, plus a few more percentage points.
For the middle 4 months ADP was on target for another 20% but something bad happened towards the end and we both had close to a 10% correction. This looks like an overnight surprise at first glance and ADP never recovered for the rest of the year.
However, we managed to double our profits from about 30% up to 60% while ADP fluctuated below its previous high.
The main point of interest here is that when ADP made normal day to day trends with little success, we made the up-trends and avoided the down-trends. Just look at the down-trend in Oct/Nov for ADP and notice that we flatlined and held cash for most of that period.
Also important to mention is this would be done with 25 trades which would cost a total of $25 with an Interactive Broker account or $87 with Tradier Brokerage.
There are always many examples every month when we publish our complete set of new charts for that month.
Sure, we are not perfect in every case but a portfolio of 5 to 11 assets is a portfolio worth having and achieves my original two goals from 8 years ago: -
1. Eliminate stock picking and
2. Choose better Buy and Sell dates.
Duplicates Taking Up Space.
We used to warn followers about taking positions in duplicate sectors with our attention based on finding enough pairs to meet our requirements.
Volume was and still is a consideration, but a fresh look tells us that duplicates are probably no longer beneficial.
We have 5 energy pairs that pretty much represent the price of oil when 1 would be enough to do that job.
We also have 3 S&P-500 pairs that also could be handled by a single pair rather than all 3. Having duplicates can increase risk when balancing a portfolio.
This started when we emphasized our selection on professional portfolio managers, and we realized that 60% was often created from S&P types of stocks so that close duplicates seemed appropriate.
By eliminating 4 energy pairs and 2 S&P-500 pairs, we make space for 12 others but taking advantage of the elimination of duplicates does not produce replacement pairs that we can use.
However, it does make sense to fill these spots with alternatives and this is where we can provide a better service by bringing back some alternative investments.
Getting back into volatility proved to be a good decision as recent market behavior has shown. The VIX Index has produced 2 pairs that have taken over the top position and they may stay there for a while.
Looking back at the performance of stocks, it was not always good, but it seems that law suits and other corporate news was not helpful. With some minor improvements, we think that a wider selection may be needed, and we are looking at those 12 available spots.
Seeking Less Volatility but More ETFs.
Asjylyn Loder in The Wall Street Journal today noted that investors are escaping volatility by choosing �Smart� ETFs.
Apparently, these are ETFs that invest in less volatile stocks and would typically include S&P 500-type stocks.
It seems that this recent volatility is causing all types of investors to have a degree of concern.
In �Investment Europe�, there is news of an increase in the ETF market of 7% in January over December which further confirms the continued growth and interest in this relatively new asset.
Leveraged ETFs normally have enough volatility of their own without help from the news cycle. This leverage comes from the options and time-value used to create the leverage every day and will increase and decrease with daily volatility issues.
A climate of high volatility over a period will affect the percentage of time-value and volatility assigned to the leverage and will increase or decline from the start to the end of the volatile period.
Due to re-balancing the ETFs in order to maintain the leverage every day, the value becomes a less precise quantity, and has reduced the length of our average trades by about one third.
On the bright side is the increase in profitability of our 2 volatility pairs even though they do not carry the same 3x leverage of most of our pairs.
This is a good example of why they are considered for hedging portfolios of traditional stocks.
Trade Length Could Affect March.
I talked about how many days we average in a trade yesterday and it may bring about some changes when we start the new month in March or April.
We normally start getting serious about changes for the next month about this time.
After constantly checking and re-checking the algorithms and charts for improvements, this shorter trade length does present some opportunities.
It may be that stock trading could be re-introduced back into the system but with some definite changes.
Reducing risk has always been a main goal since the early days and the speed of the algorithms getting in and out of positions has been excellent.
However, it presents a difference when dealing with the 3x leveraged ETFs or with plain vanilla stocks that generally move much slower.
We do have some tests going and will report on them.
Meanwhile the Best 5 and Best 10 groups have switched positions as far as performance is concerned but volatility-based pairs with minor leverage continue to perform well.
Trade Lengths Make a Difference.
One of the side effects of this period of volatile news and volatile markets has been the reduction in our trade length.
Since December 1, 2018 the average number of calendar days in regular ETF trade-days has been 5 days. Volatility trades have been 6 days.
This is considerably different to earlier pre-December ETF trades which averaged out to be 9 days.
We do not plan on changing the algorithms due to this as they have been back-tested for many years and need to operate in all investment climates.
We are looking at different ways to make some general decisions because the most beneficial aspect to our algorithms is their speed at taking a decision.
This perhaps defies the above statements because the current shortened trade length appears to lessen the results.
However, our results are still far superior to any random buy and hold strategy such as the S&P 500 stocks. Many followers will recall the results pre-October 2018, when annual returns were at levels that may seem impossible to achieve.
I have often mentioned my goal of getting away from stock picking. The consequential idea of matching professionally selected world-wide investment portfolios came from this concept.
The challenge now is that our algorithms, as applied to 100% inversely available ETF trading, has overcome the need and ability to be a good stock picker with one small difference.
There are only relatively few inverse ETFs to choose from and we are now looking at ways to rank them in different ways.
Taking this one step further, it is likely profitable to return to a current selection of well performing stocks each month; maybe 10-15 of them. The difference then would be staying in cash on the downtrends and therefore being invested less of the time.
Alternatively, a backup set of stocks or investments could be found to move into, when some of the 10-15 stock picks go negative.
Another alternative would be to manage the money available and increase the investment in new or current buys, therefore being invested profitably in the down-days by compounding your account into the up-days.
Another opportunity to balance risk against profit? - There is always a better way!
Charts Updated - No Blog Tonight.
(blog continues below chart.)
Volatility Pairs and Risk.
The VIX Volatility Index is worth keeping in mind as an alternative investment source and our pairs are doing well in recent performance.
Both pairs were in the top 10 at the start of February and were in positions 3 and 9. They are currently in positions 1 and 10 and we buy ZIV tomorrow.
UVXY/SVXY and VXXB/ZIV have produced over 50% of annual profit in 75 days and are outperforming other groups at the present time.
This is part of their advantage to act as a hedge against holding stocks and funds.
These volatility pairs are not without risk themselves and as markets trend up, they will lose some of their positive performance.
The bearish or short side of pairs carry their own pricing risk if volatility shoots up quickly and SVXY has negative leverage to reflect this. The prospectuses for all ETFs can generally be found online for background review.
The Energy sector of 5 pairs represents 25% of the total 20 inverse pairs that we follow and has been particularly volatile since October. Some of the bearish sides gained 70%-80% of their value while the opposite bullish side made equal losses.
These leveraged ETFs in conjunction with the extremely high volatility over the same time period have created severe tests for pairs trading. We continue to recommend a portfolio of pairs from different sectors to balance risk.
Since the latest groups were started this year, the S&P 500 has gone nowhere except up and down with the volatile news cycles. Selecting the length of time to remain in leveraged trades is always going to depend on future conditions but our history of trading both directions with inverse pairs and short-term algorithms remains profitable
Some Statistical Research May Help.
We have way too many numbers to sort through but some of them may be useful if you are a numbers-type person.
As we run our algorithms every day, we see some trends which repeat but are not permanent.
An example of this is the potential profit indicated from both sides of each pair.
There are 6 pairs that show almost equal potential from both the bullish side and the bearish side of the pair. The current 6 are EDC/EDZ, ERX/ERY, TECL/TECS, TMF/TMV, TQQQ/SQQQ and VXXB/ZIV.
On the other end of the scale, there are 5 pairs that show the widest potential profit from one side versus the other side. These 5 are GUSH/DRIP, LABU/LABD, OILU/OILD, SOXL/SOXS and UWT/DWT.
We make no predictions from this current data but continue to delve into it to see if benefits can be gained.
One of my priorities has been to reduce risk. We constantly are relying on the speed of our algorithms to switch between bullish and bearish conditions with enough accuracy to continuously show a profit.
Our algorithms have so far given this result.
1. We are investing in both directions with 100% inversely correlated ETFs.
2. Our invested trade length is less than 10 calendar days which allows us to trade in 3x leveraged pairs.
3. There are only about 20 pairs that meet our goals as well as having enough volume.
4. There is a wide range of ETFs within sectors and indexes to create wide ranged portfolios from fixed income to very volatile narrow sectors.
The net result of this combination in conjunction with inversely correlated pairs, demonstrates we can invest in up or down markets all year round. We also reduce overall risk by rapidly changing directions with current markets and can reduce risk further by selecting a portfolio from different sectors or indexes.
A Lot of Selling and Cash.
It seems that selling is in vogue recently as we only have one position in the Best 5 and a total of three in the Best 10.
Out of 20 pairs, we only have nine positions of which 6 are bullish and 3 are on the bearish side of pairs.
(blog continues below chart.)
Four of the 5 Energy pairs are in cash as well as both volatility pairs and two of the 3 S&P 500 related group are bullish with one in cash.
Last week we showed the VIX Volatility Index chart to emphasize how active it has been, but we have nothing else to go by but the cash positions.
It is telling us that the algorithms are un-decided in many areas and that alone could be a good thing as it preserves cash.
It is also saying trends are hard to come by today so we should wait and see which way to go.
Pairs Trading and Pairs of Algorithms.
I think the first joke I understood as a child was �What goes up when it comes down�? � Umbrellas.
A better example might be �What is open when it is closed and closed when it is open� � A Railway crossing.
There is something in these examples that reflects 100% inversely correlated pairs trading but there are also some differences.
Investments seem to go down faster than they go up and volatility goes up faster than it comes down. That maybe why the VIX is called the FEAR index.
100% inversely correlated pairs tell us that if one side goes up 10%, the other side will go down 10% and if you look at the results for one day of trading, it will appear close to being true. But then, the ETFs are re-balanced after each day of trading and it gets worse from there.
If you invest $100 and your stock goes up 10%, you will be worth $110 but if that stock then proceeds to go down 10%, you will only be worth $99. That is probably where the words Fuzzy Math came from.
Fear and risk are reflected in prices that produce the investment phenomenon. You can see the differences in the length of time that our algorithms remain in bullish ETFs as compared to bearish ETFs. The profits also average higher in the bullish ETFs than in the bearish ETFs.
However, daily management and re-balancing costs are pretty much equal for both sides of each pair.
So, inverse algorithms must invest in the opposite direction as fast as a reversal occurs, but on the second day and thereafter, they must consider whether they are going up or going down.
Looking at Portfolios.
A good reminder today about long and short-term portfolio choices and ETFs.
One of the first ETFs that matched the S&P 500 was the SPY, also known as Spiders or SPDR�s or more completely, S&P Depository Receipts.
Following are the annual back-tests for 2 sets of S&P 500 pairs. First the 2x leveraged SSO and SDS and after that, the 3x leveraged SPXL and SPXS. You can see that we generally stayed out of the downward trending inverse ETFs with the symbols SDS and SPXS when the S&P 500 Index was moving up.
(blog continues below charts.)
If you want to follow a broad range of industries and sectors, this index has returned a 9.8% annual return for the past 90 years, from 1928 to 2016 according to CNBC and LPL Financial.
Long-term investors like this return together with the diversity that it represents for their portfolios.
We follow several S&P 500 ETFs that have the leverage and have performed better than 3x the SPY return with some help. The leveraged ETFs move at faster daily rates but daily re-balancing is necessary which involves considerable cost.
There are two methods we use to take advantage of the extra leverage and to reduce the re-balancing cost for us to produce this potential extra return.
First, we trade the shorter trends within the S&P movement, which avoids much of the longer-term re-balancing cost by using algorithms to pick and choose the trends.
Second, by selecting ETFs that have 100% inversely correlated partners, we invest in the up-trends, but we also switch sides and invest in the down-trends. This is made possible by our algorithms that reduce the average holding period to less than 10 days in either direction.
It is these two benefits that create the returns that you can experience by following our pre-published Buy and Sell signals each evening. You can try the 30-Day Free Trial and paper trade for a month.
We only signal one direction at a time, but you will be trading much of the year. You are usually invested whether markets are going up or going down.
You can also choose other sectors from our range of 20 inversely correlated ETF pairs, including 2 volatility pairs related to the VIX Volatility Index.
A Typical Annual Back-Test.
Starting in February 2018, you can see that it tends to profit from trades where the normal price performance is slowly moving up in February.
It does this by taking advantage of short-term upward trends and getting out of short-term downward trends.
By early in October it was up about 25% while EDC was down about 50%.
Next, it took a few days where we went down to about 5% profit and recovered in a short time. EDC stayed flat at about a 50% loss until the end of November while we went back up again to about a 35% profit.
EDC then recovered some of its loss to about a 35% loss until today. We proceeded up to about an 80% profit for the complete year.
I chose this pair because we now must look at the next inverse ETF known as EDZ which tells almost the opposite story. From a start a year ago, EDZ had a steady ride upwards until the end of October where it topped out at about 50% profit whereas we topped out at about 180% profit.
The last 3 months were a different story and EDC lost everything, going back to 0% where it started the year and we went back to about 100% profit for the year.
Now comes the advantage of 100% inversely correlated pairs trading.
Add them both together and the back-test indicates a potential profit of 80% plus 100% for a pairs total of 180% profit for the year after a total of 148 total trades or 74 round trades. At Interactive Brokers, this would cost $148 commission or at Tradier Brokers it would cost $516.
There are no guarantees for this kind of profit but because we trade both directions, there is very good potential that no matter which way the market goes, we will do OK.
Looking at Trading ETF Pairs.
Each pair of ETFs have a bullish ETF and a bearish ETF which move in opposite directions.
You can buy either side of the pair depending on which direction you think it will go. You can also switch directions when you think it will go in the opposite direction.
(blog continues below chart.)
You only buy one side at a time and stay in cash if you are not sure which direction is most likely tomorrow.
The ETFs pairs we trade are leveraged 3x and are about 100% inversely correlated.
Our algorithms are designed to signal which side of each ETF pair is likely to go up tomorrow. By following the signals, we buy the side going up and stay with it until we get a sell signal.
We never own both sides of any pair and we stay in cash if the algorithms cannot decide on the direction.
The average length of each trade is less than 10 calendar days and the first day of ownership is usually higher than the succeeding days.
There are only about 20 of these inverse pairs with enough volume. We rank them by their performance during the previous month. We then list the best 5 and the best 10 pairs along with 2 specialty volatility pairs that are based on the VIX Volatility Index.
All pairs are based on large indexes or sectors that offer a balance of investments.
Facts about Inverse Leveraged Pairs Trading.
Our top performing ETF pair in the February groups will be TECL and TECS which represents the Technology Sector.
TECL is long technology and TECS is short technology. One advantage is the elimination of short-selling. You just buy whichever side you prefer - Up or Down.
Also, these pairs move up and down 3x faster than their underlying assets.
If the technology sector goes up 3% tomorrow and you own TECL, you will make about 9% and if you own TECS, you will lose about 9%.
The disadvantages of owning leveraged ETFs are variously described as daily re-balancing cost, decay, management cost, high volatility cost and several others which Google will supply.
They are used mainly to warn potential investors that long term holding of leveraged ETFs is a bad idea and we entirely agree.
Over the past several years, our trades have averaged less than 10 calendar days from the day you buy to the day you sell.
If you imagine that an ETF worth $100 loses its entire value for a year, due to all the above reasons, our loss for each trade would average 10/365 x $100 or about $2.74 per trade. Even with volatility losses, low losses could be 1/3 as much at $0.91 cents. High losses could be 3 times as much at $8.22 for the entire 10-day trade.
We recommend that each pair should be traded with a minimum capital of about $1,000, which puts these high-end losses at about $8.22 for each $1,000 dollars traded or less than 1%. We use two different brokers at $1.00 and $3.49 per trade so you can add $2.00 or $6.98 for each round trade to the above losses.
This puts our maximum loss in the range of $8.22 decay plus $6.98 commission for a total of $15.22 per $1,000 trade or a maximum of 1 1/2 percent. You can see from our Historical Data page that our profit potentials are well above these costs with annual ranges in the 50% to 150% annual profits which includes decay costs but does not include commissions.
Preview of new Sunday night 1A signal chart.
These will be the groups for February trading. Monday's trades will be distributed to followers as usual on Sunday evening.
Some Maintenance Facts to Know.
VXX was replaced after 10 years by VXXB which is good for 30 more years. The ETF prospectus ran out and it had to be renewed.
The all new February groups are now in effect and you may want to hold any January Best 5 ETFs until they get a SELL signal before replacing them with the any of the new February Best 5.
(blog continues below chart.)
The new February Best 10 replaces the old Investment Manager 10 Pairs. All 20 pairs are listed in rank order for current profits. No changes in these groups will be made until March 1, 2019.
Recall that the evidence in recent years trading these inverse pairs using our short-term algorithms has easily overtaken many single direction portfolios. The new Best 10 group has the potential for greater returns with less risk.
If you are following your own lists of inverse pairs, you may want to consider the new ranks for February. Most changes were caused by the unusual continuation of high volatility and it looks like it may continue this month.
The high volatility has created an opportunity for very small tweaks in the algorithms and we continue to monitor them each day. We hope the new 1A chart is more helpful in creating your own group to follow.
We no longer limit the inclusion of duplicate ETFs in our groups when they belong to the same sector. However, it can reduce volatility and risk by selecting a range of sectors.
Thanks for your continued interest in these 100% inverse pairs.
January Stayed Bullish all Month.
All bullish sides of our inverse pairs had a great month by themselves except for 20-year bonds and volatility.
Bonds often move down when stocks move up, so that makes perfect sense and the VIX Volatility Index also moves down when markets are happy.
So, why did we miss such a positive month?
Most likely, the large number of these one- and two-day reversals which do not align with our signals.
We did get a higher number of sell signals for tomorrow and the new February charts will publish on Sunday evening. That will list the new groups and ranking for February trading.
The newest group will replace the Investment Manager series with a Best 10 group, which would have less risk than the Best 5. These 10 ETFs will include the Best 5 plus the next 5 current high performers.
The 2 Volatility pairs will remain as before. We look forward to the February trading and I do want to emphasize a recent comment about 100% inverse pairs.
There are only between 20 and 25 worthwhile inverse 3x leveraged pairs to choose from and it makes sense that we work with all of them. About half of them are either major stock indexes moving slower than average or energy sector which has been moving faster.
Our experience in recent years is that individual volume has significantly increased but new issues are slow to achieve enough volume for us to be able to offer.
February ETFs Will be Chosen Tomorrow.
We will have several changes for February and will publish them this weekend. We need extra time at the start of each month in order to line up our changes and a weekend gives us that time.
I already mentioned the replacement of the Investment Manager group as it has become an obsolete method to select which inverse ETF pairs to select.
You will remember that 100% inverse pairs trading has many benefits, and these include the reduction in medium term risk from trading both directions.
This risk reduction outweighs the previous benefit of a professionally selected portfolio that we first used. Now it is more important to look at the makeup of each ETF pair and match it to our algorithms.
Each time we make a change, I realize that some followers may be disappointed, but we need to keep following any progress that we can make.
Today the Feds did not raise interest rates and the expectation is for higher markets. That was why they went up today. Our algorithms also seemed to recognize the change judging by the buy backs tomorrow morning.
The Good, the Bad and the Ugly.
The concept of trading 100% inverse ETFs and using algorithms to buy and sell them is new, although short-sellers most likely used some form of technical analysis to reverse their position.
The good can be characterized in several ways and 100% inverse movement with our ability to choose the direction is a definite bonus. No short-selling needed.
The good is also the range of movement from no leverage to 3x leverage for the same underlying asset.
In fact, the good is most likely still to be fully appreciated and developed.
The bad is the short-term history of the concept but we do appreciate all the comments that we get from followers. We come with inquisitive minds as well as some experience and our group continue to enjoy the process.
As with most technical analysis, instant news can be difficult to deal with for any investor and especially when financial news has become a 24-hour event.
Political news has become the more difficult factor as it is often instant and often not predicted.
Going back to October 2 of last year, the VIX Volatility Index entered a phase rarely seen on a continuous basis. The current range produces larger movements in both directions but also increases the time-value of futures and options that have fixed expiration dates and becomes a larger daily loss.
Triple leveraged and inversely correlated ETFs encompasses the good prospects for potential profits and also the bad daily losses from time-value at different leverages.
But they can be ugly when you select a single sector. Do not select multiple energy-based ETF pairs, unless you enjoy going to Casinos. Twenty percent moves are often seen and are often intra-day surprises.
To avoid ugly, is to select 3 to 5 minimum diverse sectors that can be jointly profitable by using algorithms to get in and out quickly. Remember, there is a small supply of these 3x leveraged ETFs to work with at the present time.
There is Always a Better Way - 2.
For those who watched us improve our signals for a few years, you know we are constantly looking for that better way.
You will see more changes soon and some of them may surprise you. Eight years ago, the goal was to improve stock picking and stock timing.
(blog continues below chart.)
Picking has meant following trends into Exchange Traded Funds and timing has meant using mathematical algorithms to trade 100% inversely correlated ETF Pairs.
We then created a better way by publishing our Investment Manager Portfolio which correlated about 90% with a series of 10 plain vanilla ETFs. Together they emulated several large multi-trillion account manager portfolios and updated along with their monthly statements.
We quickly found that our algorithms, which were designed for short-term trades of less than 10 days on average, could also work more profitably with highly leveraged ETFs. This capability could take advantage of short-term ownership which cancels out the large daily management costs that typically exist with leveraged ETFs.
The later introduction of 100% Inversely Correlated ETFs has now pushed us into even greater profit areas. Our algorithms now can give us profits from ETF Pairs, by switching sides to remain mostly in a profitable direction.
When one side of the pair is going up, we make profits, and when it goes down, we switch and trade the inverse side for additional profits. We have the potential to be invested almost all year-round, making profits from whichever side of these inverse pairs is currently going up in value.
We no longer need the old concept of selling-short in order to profit from downside moves.
So where do we go from here? Stock Picking for us has been overtaken by Pairs Picking and Pairs Timing. We are now taking advantage of always seeking the better way, but this eliminates what we started with eight years ago.
We no longer need to match Professional Investment Manager Portfolios. The progression into inverse pairs trading has overtaken stock picking mostly with our ability to trade profitably in both directions.
What we are doing now is Ranking ETF Pairs Trading into a portfolio that has the greater potential. Doing it with inversely leveraged pairs has replaced our Investment Manager selections which have a lower priority today.
Volatility remains a favorite sector due to its partial hedging ability in any portfolio as well as the different timing.
Daily Profit from Leveraged PAIRS.
The bullish and bearish sides of each leveraged ETF pair move up and down every day by an equal percentage.
So, we must select the side with the greatest upside potential for tomorrow.
We also must hold positions for a short number of days, to avoid the daily management costs that provide the greater leveraged profit.
At Roebuck Systems, we produce algorithms that tell you which side has the greatest potential for tomorrow.
That is this new trading method called: - Inversely Correlated Pairs Trading.
The advantage is the ability to profit in both directions, rather than only buying on the way up. Hopefully, you would be holding cash on the way down.
We produce mathematical algorithms every day that give you precise signals, telling you which side of the pairs has the greatest potential for tomorrow. We then distribute these to our followers each evening.
At your convenience, you simply place orders for an opening trade tomorrow.
1 Buy one side of the pair.
2 Stay with previous position.
3 Switch to the opposite side of the pair.
4 Sell current position and hold cash.
You can select as many pairs as you like and invest about $1,000 or more in each pair. We recommend a minimum of 3 pairs in different sectors.
We use a ranking system based on recent performance and currently maintain a daily list of 20 inverse pairs with high volume that meet or exceed our daily requirements.
For trading, we also recommend Interactive Brokers with a $1.00 trade commission or Tradier Brokers with $3.49 commission. We use these brokers ourselves because of lower commissions and good service.
Note that we do not have any financial arrangements with either of these brokers. Tradier has a new account offer of $200- or 60-days free trading.
4 Indexes Have Inside Days Today.
5 minutes before the market close today the S&P, Dow, Nasdaq and Russel all were having inside days today.
That means all highs and lows were within those for the previous day.
(blog continues below chart.)
I know that we are going to run the algorithms after the market closes today when we totally ignore everything I used to look at for many years.
Inside days are thought to be when prices take a breather after a trend, but they like significant primary trends to be most predictive. Even then, they get a little fuzzy as to which direction to go.
A major problem is deciding which technical analysis method is going to be decisive today.
It is important to know the original strategy by the person who devised it. Improvements and variations are out there, along with various interpretations and combinations.
Having tried many of these methods, the move to warrants and options promises greater movement along with greater profit and lots more excitement.
If this does little to sustain profits, a move into futures and commodities could work out. There are accounts managed by expert brokers if time is a limiting factor.
That is when and how consistency became my own goal and mathematical algorithms became my solution. GIGO is the key concept here � Garbage IN, Garbage OUT.
So, we use algorithms that consistently follow the same principles and make the same boring decisions every day.
However, that does not stop me from old habits and I personally like 50-day and 200-day moving averages on the chart and MACD below it. After all, judgement is important when investing.
Final thought - one indicator that had an UP-day was Emerging Markets, so the risky end of the spectrum was alive and well. Also, surprisingly, 19 out of 20 algorithm pairs are bullish for tomorrow except one volatility pair that is undecided.
How are Investment Managers Doing?
Investment Managers Portfolios are doing ok but struggling to deal with this volatility.
Volatility investors are doing very well, as you can see from our algorithm groups on Chart 3X.
I have mentioned previously that the CBOE Volatility Index serves as a hedging vehicle for many professionals and our recent results seem to back that up.
I used to like trading XIV before it was removed by Credit Suisse, but our current Volatility Pairs are doing well.
I added the special notice chart to the blog yesterday to demonstrate how wide the concern is for economies around the world. Some of my relatives in the UK are really concerned as the British have difficulty seeing what lies ahead.
Perhaps the Best 5 Pairs next month should include both volatility pairs but that would go against our recent decision to avoid duplicate sectors in that high-performance group.
One idea during these times might be to take the top 3 ETF pairs in January and add both volatility pairs to make up a hedged portfolio.
Even though we trade both directions, investing still requires management and judgment. If you see difficult times ahead, it will surely mean continued volatility for that Index.
I am slowly talking myself into doing that for February. I do not see resolution to anything suddenly changing the outlook within the next 30-60 days. However, I will wait for the end of January to make the decision.
Special Notice + How to Handle IRAs.
Political and significant news events change the day-to-day market volatility.
The BREXIT collapse and the tariff effects in China and the USA, as well as our own political daily uncertainties are creating these circumstances.
The following chart from Bloomberg showing the Global Economic Policy Uncertainty Index should be considered by all investors.
IRA Accounts - I have used my accounts as test vehicles for many years, but tax-sheltered accounts can bump up against the Trade +2Day banking rules (T+2).
A good way to minimize this problem is to upgrade your IRA account to a Limited Margin IRA Account. You will not be able to use margin, but it will help your available trading balance.
Each evening, I like to place all SELL orders first before placing the new BUY orders. I then divide the current account value by the number of pairs that I am following to determine the value and quantity for each new ETF that I need to BUY.
If I am trading 5 pairs in this account, I always like to leave about 1% or 2% of cash when placing the last of my positions. This allows for changing prices at the market open and avoids cancellations for insufficient funds.
After the markets open, I try to check in just to see if all orders were completed. I can then replace them if an unexpected price or event occurred. Overnight broker maintenance can occasionally cancel pre-placed orders.
Even with these considerations, if you are selling an ETF from having a full house of pairs and with a limit of funds available for trading, you will have no choice but to wait for funds in order to place orders.
We do stipulate that it is best to place all orders to Buy or Sell on the first day that the signal changes, but there are events that cause you to miss a day or two and you will still be correct to place late trades.
A good example of this is when you first begin trading our signals. It is best to place all buy signals, even though they may not be a first-day signal.
FREE TRIALS Receive Complete System.
By reading the previous 2 days of this Blog, you will know what to do when you follow our algorithms.
The Chart 3X shows how well you could have done since December 1.
(blog continues below chart.)
This is as simple as it is new and small investments have huge potential profits.
I am showing you our Chart 1A below, which you receive each evening.
There are instructions at the bottom but I want to explain it in more detail so you can better see exactly how simple it is to follow our algorithms each day.
If there is a -T- on the green border in front of the first column, that tells you exactly what to Buy or Sell at the next trading day open. Ignore everything else.
There are a limited number of these inversely correlated ETF pairs.
ETF or ETN stands for Exchange Traded Funds or Exchange Traded Notes and in many ways, they replace Mutual Funds.
The benefit that we use is their ability to create 2 Funds that move in opposite directions at the same time. This is extremely beneficial but very much overlooked.
This is done by using Call Options for the bullish ETF and Put Options for the bearish ETF. This creates 2 separate ETFs that move in exactly opposite directions every time a trade is made. Sounds impossible? Yes, but that is exactly what they do and here is an example.
We can use the S&P 500 Index to demonstrate.
SPXL is the trading symbol for the bullish ETF and it represents all 500 stocks and moves up when the Index moves up.
SPXS is the symbol for the bearish ETF which also represents all 500 stocks but if the Index trades up, SPXS will trade down, exactly opposite to its partner SPXL. In fact, if SPXL (long) goes up 2%, then SPXS (short) goes down -2%.
Several Companies create this booming world-wide industry, which is quickly overtaking Mutual Funds, and Direxion is responsible for this pair of ETFs.
Here is an advantage of ETFs.
This pair of ETFs is leveraged three times (3x). Each day, they are re-balanced to produce 3x the movement of the underlying asset. In this case, if the S&P 500 Index moves up 1%, then SPXL will move up about 3%, and SPXS will move down about 3%.
WOW! If you knew which direction the S&P 500 Index was going to go each day, you could triple your profits when it goes up and triple your profits again when it goes down. That is why we say we profit in both directions.
There is a disadvantage.
Because these leveraged ETFs are re-balanced each day by using Put and Call Options, there is a small cost each day. These ETFs are not designed for long term investments and the shorter time is better to avoid this cost.
Here are the two keys to our unique algorithms and signals.
First, they are uniquely designed for each pair to determine which direction each side is likely to go tomorrow. If both sides say -Sell, then the algorithm is undecided, and you will stay in cash.
When you see the -T- in front of your ETF, that tells you to Buy or Sell at the opening price tomorrow. If there is a -T- in front of both sides of any pair, you will be switching sides by selling the one that you already own and buying the other.
Secondly, the average holding time for each trade is less than 10 calendar days.
After Choosing from Our ETFs.
Maybe you have chosen our 2 Volatility pairs or our 5 Best Monthly ETFs, or our conservative 10 Investment Manager ETF Pairs. You can select any of the 20 pairs that you receive each evening.
Note that we recommend that you select no more than 10 of the top ranked pairs with no duplicate sectors.
(blog continues below chart.)
The reasons for our recommendations are that not all ETF inverse pairs are equal. Also, Energy ETFs often refer to the unique price of oil or gas and duplicating this group can cause much higher price movements or volatility.
Your second decision is how much to invest, and we have some good general rules for you. Mainly we recommend a minimum of approximately $1,000 for each pair and second, is a minimum of 3 pairs except for the 2 Volatility Pairs which have minimal leverage.
We strongly recommend that you use the up-to-date ranking system seen each evening and stay with your choices for a few weeks or more.
Now you are almost ready to trade. One aspect of trading these inversely correlated ETF pairs is you tend to do a few more trades because you are almost always in the market and brokerage commissions can be important. We use 2 recommended but different styles of brokers.
The cheapest commissions are at Interactive Brokers at $1.00 per trade. They are a world-wide broker with a more-complicated and wider range of trading opportunities.
The simplest is Tradier Brokers at $3.49 per trade. Their website is easy to operate and cheaper than most. We have no financial benefits from any brokers but Tradier does offer $200 or 60-days of free trades to new accounts using the code ROEBUCK200. This is for their own marketing purposes.
We do recommend you try our 30-day free trial and paper-trade for a while. You will get used to the signals and trading information that we send out every evening.
The day you see a capital -T- next to one of your ETFs, is the day you need to place an order to Buy or Sell at the following Market Opening price. A - MARKET - order or a - MARKET AT OPENING - order are the usual instructions anytime after markets close and before they open on the next trading day.
A note here is that Interactive Brokers require orders be placed after Extended Hours trading which is 8:00 PM Eastern time. Under Order Type select MKT and under TIF select OPG. This can be confusing because their instructions do not mention this.
By following these few steps and joining our list of happy followers, you will be at the forefront of this entirely new way of investing. While the daily volatility may be higher than normal, the risk is minimized by trading leveraged and inversely correlated pairs in both up and down directions.
How to Follow Our Trades?
First you need to select which ETF Pairs you want to follow. That could be: -
1 Your choice from the 20 ranked pairs.
2 The 2 Volatility Pairs.
3 The 5 Best Pairs from last month.
4 The 10 Investment Manager Pairs.
(blog continues below chart.)
Ranks and Sectors are important to consider. Otherwise choose one of our groups. Risk is greatly minimized by trading inverse pairs with proven signals and avoiding duplicate sectors. Do not trade more than 10 Pairs and be sure they represent your specific goal.
Risk and Inverse Pairs.
Our algorithms have historically demonstrated their ability to correctly enter and exit trades in an average of less than 10 calendar days. This short-term feature becomes valuable when dealing with 3x leveraged ETF pairs.
The benefit of inverse pairs is you are always trading an asset that is expected to go up by simply switching between the bullish and bearish sides of each pair. You just follow our buy or sell signals to maintain trends with no need for short-selling.
If the direction is undecided, you will remain in cash until a decision and signal to BUY is made. You will never be in both sides of a pair and should divide your investment by the number of pairs that you decide to follow.
The algorithms will get you out of negative trends by switching sides into the opposing side of the pair. As our algorithms are constantly searching for the positive and upward movement, both bullish and bearish trends become profitable UPWARD trends.
Making a profit in all trends, whether they are up or down, using inversely correlated ETF pairs and our algorithms have the benefit of reducing risk levels and improve the potential for short- and long-term profits.
Daily movements will be larger due to the 3x leverage, but we think the potential for short to longer term profits are well demonstrated by our approximate 3 years of published results.
How Often We Trade.
Since we started a new round of trading groups on Dec 1, 2018, we have recommended 139 completed round trades plus 19 open trades.
That is a total of 297 total trades for 40 ETFs within 46 calendar days.
That is 7.4 trades per ETF and about 2.5 trades per market open day if you took every signal on every ETF, which we do NOT recommend.
We use 2 different brokers for our own accounts and can recommend either of them. They both offer orders at the following day market opening price.
The largest group that we recommend, and follow is the Investment Manager group, which offers a range of 10 pairs of ETFs that largely correlate with professionally managed and selected world-wide portfolios, including fixed income.
This group has 55 round trades with 9 open trades totaling 119 for the same 46 days and just 20 ETFs. This suggests 6 trades per ETF and less than 2 trades per market opening day. They are placed at your convenience before the next market opening.
Chart 3x lists the average monthly round trades for each of the 3 groups that we currently follow publicly, and the Best 5 ETF Pairs includes the top ranked pairs for the previous month but avoids duplicate sectors.
In 2019, we have started reporting and ranking each pair of ETFs because of many differences that occur between them.
Some extreme differences can be seen between URTY/SRTY which represent 2,000 stocks covering wide ranges of operations and the 2 pairs of ETFs representing different aspects of the VIX Volatility Index, mostly with no leverage.
Through the years of research, we can see that additional benefits may be generated through our ranking system and these benefits may well have positive effects on our decisions.
Because Inverse ETFs are New . . . .
Inversely correlated ETF pairs represent a completely new way of investing and here is how they do it.
Many years ago, companies bought a range of stocks and created a Mutual Fund so that investors could hold a collection of stocks with a single buy.
Along came Options on stocks which increased movement and risk resulting in the ability to add Leverage to the movement of stocks.
Finally came ETFs which are generally more cost effective than Mutual Funds and have quickly become preferred.
Mutual Funds have annual management and load fees that can generally range from 2% to 8%, whereas ETFs are usually less than 1% per year.
ETFs can represent stocks or assets in almost any sector that you like to follow but they have developed the ability to replace a stock with its options.
With heavy use of computers, they can add leverage or additional movement to those underlying stocks and by re-balancing the quantity and range of options every night, the ETF can have a pre-determined amount of leverage at the opening price every day.
Options traders know that there are Call Options for investors who think the stock is going up and there are Put Options for investors who think the stock is going down.
Both can be used by ETF producers and this is the secret sauce that creates ETF INVERSE PAIRS that move in the exact opposite Bullish and Bearish directions.
(blog continues below chart.)
Consider the S&P 500 Index. If you are confident that this Index is going up tomorrow, you can BUY SPXL, which represents all 500 stocks and will start at the open tomorrow moving UP 3x as much as the Index moves UP. This leverage uses Call Options.
On the other hand, if you are confident that the same Index is going down tomorrow, you can buy SPXS which will start at the open tomorrow moving UP 3x as much as the Index moves DOWN. This leverage uses Put Options and therefore goes UP at 3x the speed that the Index goes DOWN.
By using PUT or CALL options, the same ETF can be produced except that it moves in the exact opposite direction. That is why we have SPXL (Long) and SPXS (Short). If you check the price anytime, you will see that if one of them is up 2%, the other will be down 2%. The other great advantage is there is no short-selling and both sides can be bought just like buying a stock.
Our algorithms are specifically tuned to these high-volume inverse pairs of ETFs and predict which is the potential direction for tomorrow. This tells us which side of the pair to own. When undecided, they will keep us out of BOTH sides and the typical trade is for less than 10 days.
The trades are for relatively short periods because we avoid the management cost of re-balancing the leverage every night.
We Welcome Questions.
There is little information on trading inversely correlated ETF pairs so please send us questions. It always helps us to explain all the great benefits.
We probably have the first technical trading signals for highly profitable trading of these ETFs and especially for leveraged ETFs with superior profit levels.
Just since Dec 1, while markets have been punishing IRA and 401K accounts, our daily signals have produced profits of up to 11% with annual returns of 97% with REDUCED RISK.
Our instructions and signals are simple and easy to follow for all investors.
These inverse ETFs are relatively new to individual investors, but not new to large international accounts. They are rapidly replacing Mutual Funds as lower cost assets and hedging vehicles.
They replace many Mutual Funds and they trade in pairs in opposite directions. They are bought and sold just like stocks and all you need is their expected direction for tomorrow.
Our algorithms send you that expected direction each evening for the following day and you invest at your leisure without ever having to watch the markets.
Risk is minimized because you get to trade them up as well as down, in both directions and over short periods of time. You can benefit from profits in whichever direction they are currently moving.
With the up and down changing trends, we profit in either direction, and our 3-year record of correctly predicting direction, puts you on the correct side of most trades for an average of less than 10 days for each trade.
When did you last make a profit when your stock went down? You do not have to do any short selling to achieve this strong performance.
Look at our profit charts for various groups during the last 3 years. Every group has made a profit and is pointing up.
Daily Algorithm Back-Tests.
The attached Algorithm chart shows the results of running them today.
The right-hand column shows you the actual ETF percentage gains over the past year, before using our algorithms.
Of course, half of them are Bullish and half are Bearish, and you would expect them to balance out with a small percentage result for the same period.
The middle column shows that after back-testing and using our algorithms, the same ETFs make an average profit of 95% and none of them make a loss. This shows how well they behave when markets change to the opposite direction, no matter if they are a bullish or a bearish ETF.
The worst performance by an ETF with no help from the algorithms was the bullish UWT with a loss of -73% for the year but with the algorithms, a profit of 69%.
The best result by an ETF with help from the algorithms was the bearish DRIP with a profit of 364% for the year but that included a natural profit of 106% without the algorithms.
Why are these numbers significant and what are they telling us?
It is difficult to make assumptions because every market condition for every period is different. The millions of traders act differently every day for each ETF.
We think one of the most significant facts from 8 years of study is that none of the ETFs make a loss with our algorithms during the period and we find this to be true for all reasonable periods.
Another significant feature is the lowest positive result after using the algorithms is for TMV at a positive 13%. But this is not surprising because this is the Bearish side of the 20 Year Treasury Bonds.
We include this TMF/TMV pair of ETF Bonds as part of our Professional Investment Manager group, which needs the availability of a fixed income asset.
When you add the above benefits and features to our investment groups, it demonstrates more fully how well they perform.
(blog continues below chart.)
The application of a well-developed short-term set of algorithms can produce profits from leveraged inversely correlated ETFs that would normally be considered high risk and expensive to own.
Less than 10 days average holding period with historically precise entry and exit signals is the key to all the results.
Trading Through Elections.
We have made lots of comments about the political news since October in the USA and around the world.
An early chart that we published on Dec 7 showed how a new volatility range took over on October 4.
Here is the original chart plus an updated chart showing daily volatility increased in December and appears now to be close to recent averages.
Although we have done well over this period, the trade % chart shows that the average profit percentage of our January groups is down to 61% profits.
This percentage has generally ranged from 60% to 70% in the past, showing that while our volatility pairs generally do better in high volatility markets, the other groups pay the price.
61% profits and 39% losses are still acceptable, especially when the S&P 500 has suffered during the same period, but it does help to show the effects on our algorithms.
Over time, volatility tends to go up faster than it comes down, but it is a great indicator of uncertainty and surprises for the investment community. There are still political uncertainties to be resolved here and in the UK with the BREXIT vote and the Common Market with Angela Merkel ending her role in Germany.
It is unlikely that this high volatility range can stay for ever but until political uncertainties begin to show some solutions on the horizon, it may be slow to get back to pre-October levels.
Meanwhile, although the volatility pairs have fewer trades, they have improved their position since we introduced them and may be a place to hedge positions.
An Idea Not Proven . . . Yet.
There are a couple of reasons why we wanted to start groups with a new start date of Dec 1 instead of the previous Mar 5.
Mainly, we were starting with the new ranking system in January, but the previous date was in the middle of a lower volatility period and we also like to renew the dates every so often to keep up with time and markets.
Another reason is the new ranking data and it was tempting to rely on it to give us a new constantly changing Best 5 group of ETFs.
Volatility does not currently want to cooperate and just as it went up from October through Christmas Eve, it has come down by 45% since then. There is always going to be new conditions, but we continued to make good profits during this volatility reversal.
What delays the concept of a constantly changing Best 5 group, is the shortage of history for the ranking system. It probably needs another month or two of history so that the rank changes less often and the best ETF pairs need time to show their strength.
We will keep testing this and report at a future date. Another reason that hurts the concept is too much trading and switching which comes up against the associated 2-day banking rule.
Why we Recommend 30-Day FREE Trials.
We started our algorithms with stocks and non-leveraged ETFs and had great success without considering any leverage at all.
I have previously mentioned that we also started with the concept of producing very short-term signals, with the idea that we wanted to get in and out of positions as fast as possible.
The result was their sensitivity did in fact give us a high percentage of correct decisions but were perhaps more sensitive than was required to trade non-leveraged assets. This is where 30 days of paper trading might be useful to adjust to them.
That is when we combined them with leveraged ETFs and found that their potential was to obtain a result in excess of double that of the non-leveraged version. We have historically produced about 200% of the 300% that is offered by the leverage as indicated by our actual data on the Historical Data page.
The easy way to see this is our average length of round trades is less than 10 days, avoiding holding them for long periods of time. There is a considerable cost to holding leveraged ETFs due to the daily balancing cost to maintain the indicated leverage.
Now add to this the ability to trade and profit, whether the markets are going up or down and you begin to see the importance of the algorithms and inversely correlated ETFs working together.
Without a profitable method of limiting the number of days in a leveraged trade, these types of trades can be excessively volatile, and it would be difficult to maintain profitability at any level.
The reason that these ETFs have such large volumes is often caused by their use in large portfolios for hedging and very short-term trading. It is a good way to reverse or neutralize a position when needed.
They are not intended for long-term holding and we do not recommend holding these leveraged ETFs without consideration of their very high maintenance cost.
Technical Analysis or Algorithms.
I printed an example of SOXL today when it appeared to be at a favorite set of moving averages, namely 50- and 200-point moving averages.
My chart is every 5 minutes so 50-points represents about 4 hours and 200-points are close to 2.5 days.
Notice that the price at about 11:30 AM is hitting the blue, long-term 200-point signals, having burst through the red short-term signals at the opening this morning. We signaled buy it today.
The question is, where does it go after 11:30 AM today? We will check later.
I will know before writing this blog, but I am trying to convince you that algorithms are also Technical Analysis and perhaps can make more convenient decisions in the long term.
Below the price chart is the MACD chart that helps to see the strength of the move, but at the 11:30 AM timeline, even the MACD is telling us little about future direction and more about history.
There is no shortage of Technical Analysis methods that can be used. Some are preferred more than others. The most important factors are the results in your account after making those decisions day after day. Paper-trading for 30 Free Days would be a good idea.
This attached chart represents the decisions that we must make, either intra-day or longer-term, on a consistent basis. Our algorithms are now making those directional decisions once every day with an average of 60% to 70% accuracy. We have been publishing ahead of time for about 3 years now and they are all posted on the Historical Data page.
We like to recommend a 30-Day Free trial that gives you a complete set of our signals every evening. You can then measure their performance against any Technical or Fundamental Analysis that you may be already using.
See the second chart. I did check SOXL at the close today, as it was signaled for a buy at the open this morning. You would have bought at $73.83 and the value at the close today was $79.42 for a first-signal-day profit of 7.6%.
With SOXL, we were either 60% to 70% lucky today, or we were 60% to 70% correct today!
Up & Down Volatility Since Xmas.
From highs up an average of 60% during October through the election and again until Christmas, volatility jumped up an additional 70% through the New Year.
This period has been a very interesting time for the algorithms and they have performed well.
(blog continues below chart.)
Considering there has been more rapid in-and-out trades, they certainly did not participate in the -19.4% market losses of the Dow stocks in the same period.
Since Dec 1, our average group is up 7% and the Best 5 Pairs are up 11% to date.
Our originating concept and Investment Manager Portfolio of 10 ETF Pairs, which correlates about 90% with portfolios of large world-wide investments, is up 3% over this difficult period.
The enemies of our algorithms are the up one day, down the next day of high volatility, but there are enough short trends to allow us to reverse direction and to profit.
Who knows when this volatility will normalize but we have demonstrated an ability to profit throughout all 4 quarters of 2018 as well as previous years. The up trends and down trends were great and the high volatility periods also proved to be successful.
It is no secret that our algorithms were developed over a multi-year, generally up-trending market, and this last quarter has been a new and severe test. I hope we can introduce more investors to experience this great new opportunity in inversely correlated pairs trading.
An adequate supply of high-volume inverse pairs has been the first key to our ability to trade both directions of an Index or unique sector. The success of these ETFs with enough high volume, will probably lead to an increasing supply in the future. We continue to consider new opportunities.
The second key is no doubt our short-term directional algorithms, mostly proven over the past 3 years, that quickly reverse signals with a 60% to 70% accuracy.
You can now make profits on the way up and on the way down, with short periods of indecision, and average trade lengths of less than 10 days in either direction.
Taken over a long period of time, the average First-Day signal makes better than a 2% profit which is further evidence of good directional reversing and is another reason why we strongly suggest buying and selling on that first day of a signal change.
Handling Best 5 Pairs Changes.
Several questions about the new Best 5 Pairs group and the changes we are using.
First, we have listed the best available 20 pairs with new rankings so that followers can create their own groups for investment.
Our Best 5 group will no longer include duplicate sectors based on the recent experiences with oil prices. The 30% drop in oil prices in the Nov/Dec period caused very high volatility.
There are several factors to consider each month when a new Best 5 is listed.
My initial method of switching is to wait for a Sell signal in my previous Best 5 group and then use those funds to switch to the new Best 5 group.
I sometimes overrule this if I can sell the old ETF on a profit day and buy the new one at a lower price.
However, with broker fees being so low, it is perfectly reasonable to sell the old and buy the new, if the T+2-day banking rule leaves enough capital in my account.
This may be a good time to mention Margin Accounts. If you have a non-pension account that allows it, changing to a Margin account can solve some of those banking rules by using borrowed funds just for the 1 or 2 days during the switch. The interest cost is very low.
Even changing your IRA types of accounts to a higher option level, will help with available capital rules and your broker can help here. Unfortunately, leveraged ETFs use up higher Margin, so this also must be considered.
We did think of providing a constantly changing Best 5 group with the new ranking numbers that we provide to followers. We decided that changes were occurring more often as we switched all reports to the new December 1 start date, so this concept may come later.
As mentioned, we did eliminate some of the volatility by avoiding duplicate sectors such as oil in our Best 5 group, but you can select your own group with the new ranking now available.
January Changes are Here.
Three of the best performing and most popular of our groups remain but you can now select your own favorite group of inverse pairs by reviewing the 1A Chart on our FREE 30-Day Trial.
Chart 1A includes the top 20 inverse pairs with new profit columns since Dec 1 plus the ranking column showing where most profits were recently generated.
Our original Investment Manager group remains with few changes and still correlates with professional portfolios.
Also, our Best 5 Pairs group remains as well as the 2 Volatility Pairs group.
The Investment Manager group will own a maximum of 10 ETFs that are approximately 90% correlated to professional portfolios held around the world. It includes ranges of stocks, fixed income and specialty sectors for investors able to invest in a maximum of 10 ETFs. Duplicate sectors are included in this group to reflect professional portfolios.
Our Best 5 Pairs group avoids duplicate sectors which helps to avoid excess volatility in a small portfolio and is selected each month based on the previous month performances and ranking.
You can adapt this list of 20 inverse pairs to your own needs and preferences to create your own favorite group. We suggest that you invest in a minimum of 3 pairs with about $1,000 in each pair.
The last change to our algorithms was the elimination of buy signals for both sides of any pair as you are essentially neutral when in the same inverse positions. The very small potential gains from owning both sides are not worth maintaining extra capital for those few occasions.
Therefore, the number of pairs that you select will always be the maximum number of positions you will buy as you switch between each side of any pair.
Remember that the average length of ownership is less than 10 days due to the short-term design of our algorithms. This avoids the large management costs always associated with leveraged ETFs but allows us to pick up 60% to 70% of the leverage in extra profits.
The New Inverse Pairs Trading.
A new simple concept turns out to be a better solution and is a new way to do pairs trading using inverse ETFs.
We used to think of Pairs Trading in a completely different way before the recent introduction of Inverse ETF Pairs.
It was a skill where traders select two assets with similar trading patterns and buy one and short-sell the other.
By trading the changing spread between the two assets, relatively low risk profits were made as they moved apart and came back together again.
The tricks are the selection of the pairs and the use of a good technical signal to switch directions as the spread increases and decreases.
Our new inverse ETF pairs trading puts this previous method on steroids at least three times.
First, instead of using single stocks, these ETF pairs use various sectors and indexes such as the S&P 500 or Russell 2000 that eliminates the search for good selections and works towards reduced risk.
Second, by the inclusion of put and call options in their design, they maximize the speed of movement by as much as three times.
Third, the pair is inversely correlated to move in exactly opposite directions and that maximizes the spread very quickly.
So, we have assets known as inverse ETFs, that are designed to maximize the available profits by replacing the original pairs of stocks or indexes.
What is needed now is a technical signal that is designed to deal with the speed of these new pairs and can accurately get in and out with larger profits and maintain low risk.
Just as most technical analysis is based on mathematical suppositions; Roebuck Systems algorithms were first designed for short-term and to quickly get in and out of stocks.
About 3 years ago, we made the switch to ETFs and from there, we recognized that our concentration on short-term, made them uniquely able to work with leveraged ETFs.
Our average holding period is less than 10 days, causing considerable increased profit as well as additional trades. The Historical Data page on our website is full of examples from the past 3 years of pre-announced and pre-published trades that we had announced along with resulting profits.
In conclusion, from stocks to mutual funds to options to leveraged ETFs, and now to Inversely Correlated ETF Pairs, new opportunities have used technical analysis to guide many investors.
The new version of inverse pairs trading is here to stay, and taking the time to follow it, may be very beneficial. Our new January ranking formats and groups will be here tomorrow.
Yesterday�s Blog for Saturday Dec 29 is useful for additional information on the rankings and new groups.
Wednesday Will be Different!
Knowing that Tuesday night signals will have a different format for trading on Wednesday, here is a heads-up today.
Our master list of 20 inverse pairs will have different displays of data.
(blog continues below chart.)
The last column shows profits or losses since Dec 1 and the prior column ranks all 20 pairs based on those recent profits.
We are eliminating all single direction trading algorithms in favor of our inverse pairs trading groups. This is all due to the increased profitability and built in risk avoidance that inverse pairs provide to investors.
The central column which displayed the group, will in future display their ETF Sector and make it easier to avoid duplicates when deciding which ETFs to follow.
Most of these pairs move in exact opposite directions and are 100% inversely correlated by using put or call options in their design. These same options also provide the leverage that ETFs can offer and most of our pairs have a 3x leverage factor.
It is important to remember that our short-term algorithms provide average holding periods of less than 10 days per trade.
We will retain the Investment Manager series of 10 pairs that reflect professional world-wide portfolios. The remaining pairs that made up our Mixed 10 Pairs group will still be available but not recorded separately as a group.
The Investment Manager series correlates to approximately 90% of large institutional portfolios and includes appropriate ranges of stocks, fixed income and specialty sectors. Higher value accounts will appreciate their conservative balance and the extra performance that the group has previously generated.
A favorite to follow will be our Best 5 Pairs group that has performed extremely well and usually includes one or two changes each calendar month. The group rotates monthly to reflect the best performers from the previous month.
Finally, we will also continue our 2 Volatility Pairs that reflect the CBOE VIX Volatility Index and represent an alternate source of interest for investors.
A Set of Rules to Invest By.
How to use our Booster Algorithms to trade Inversely Correlated ETF Pairs?
Follow our Booster Signals each evening. New orders should be placed with your Broker any time before the next MARKET OPEN.
Treat all pairs as a single investment. You will never have 2 buy signals for any pair. If you have previous sales from either side of any pairs, reinvest the proceeds from those previous sales into the same pair.
It is best to place all orders on the FIRST signal change from a Sell to a Buy or from a Buy to a Sell.
Signals should be taken anytime if the first day signal is missed.
You will never receive signals to Buy both sides of any pair. If you choose to follow 5 pairs, your maximum positions will be 5 ETFs.
When both sides of any pair have a Sell signal, the algorithms are undecided, and you are in a neutral position, waiting for a Buy.
When both sides of any pair have a Sell signal or after any Sell signal, you may choose a different pair to follow if preferred.
Keep these ETFs in your account for as long as they have a Buy signal and Sell them on the FIRST day you receive a Sell signal.
Suggestions for Choosing Which Pairs to Follow. Here are some tips.
Professional Portfolios generally fluctuate with market conditions and contain 50% - 70% of US Stocks + 30% - 40% of European and World Stocks + 10% - 30% of Fixed Income and Bonds +10% of Specialty Items such as Volatility. DIVERSITY reduces RISK.
Our complete set of 20 leveraged pairs includes adequate volume but also includes some duplicate Sectors.
The original diversified group is our Inv Mgr 10 Pairs 3x representing professional world-wide portfolios. The highest performing group is generally our Best 5 Pairs 3x which includes some changes each month and avoids duplicate sectors. Finally, our Specialty group consists of 2 Volatility Pairs related to the CBOE VIX Volatility Index.
Here are some suggestions for how to make your selections and the amount of money you want to invest.
1 � If you have $2,000 - $3,000 to invest, select 2 or 3 diversified pairs from the 20 ETF Pairs ranking list.
2 � If you have $5,000 - $10,000 to invest, select 5 to 10 pairs. Consider following one of our groups.
3 � If you have $10,000 or greater to invest, Consider our Investment Manager group or your own selection.
When you have determined your choice of pairs, contact your preferred broker to place initial trades, spreading your money evenly across the ETF Pairs. As you proceed, you may decide to keep profits with the same pairs of ETFs.
Look for the new Buy and Sell signals each evening. All initial signal changes are marked with a capital T. If you are just starting, you may decide to take Buy signals at any time. If the signal for one of your choices has a capital T, it is an initial Buy signal and you may have 3 different options.
1 � Reinvest your original amount and percentage for that pair and take out your profits for living expenses.
2 � Adjust your investment to your new current account value, using original or similar percentages for each new Buy.
3 � You may wish to select a different pair of ETFs for your next Buy.
If the signal for one of your ETFs is the first Sell signal with a capital T, you need to sell all your shares at the next Market Opening.
A Few More General Suggestions for Pairs Trading Beginners.
We suggest a minimum of $1,000 to be invested in each PAIR chosen.
Choose a minimum of 3 to 5 Pairs from different ETF Sectors. More selections decrease volatility and risk.
Our �TOP 5� group can change each month and will avoid duplicate sectors.
Recent combined pairs performances are generally better indicators for future performances.
Follow the rules for best longer-term results. Market opening prices are not reliable indicators of market closing prices.
Interest Rate Whiplash.
Boxing Day whiplash this year was caused mostly by concerns about how long the Fed Chairman will have his job.
That job is not normally in doubt and we will most likely see the current VIX Index continue the current high levels of volatility with this and other political uncertainties into the new year.
The advantage of pairs trading will adjust to these facts and continue in a positive direction over time. Volatility affects the value of both Puts and Calls and consequently, affects both sides of the leveraged pairs that we advise trading.
As we move into the new year, the chosen January 20 pairs will stay consistent with December, except we will start a new series of charts from December 1, 2018 to replace the previous charts from March 5, 2018.
As usual, previous groups of charts will be moved to the Historical Data page for reference.
Due to December being a record negative month, it may be instructive to compare recent results against the S&P 500, which appears on all charts for that purpose.
Our algorithms managed to switch directions and show a considerable benefit compared to the S&P 500 Index as they spent most of December avoiding that huge decline.
We would all rather see profits but sometimes the lack of losses is a worthwhile result and is the reason for trading inverse pairs with us. The S&P Index is down 18% from its recent highs and most IRA�s and 401K�s have suffered major losses since those mid-September highs.
S&P Down -14.1% & Pairs Trading Up 6.6%.
Here is a sample that all followers will be receiving in January, showing returns since December 1, 2018, just 24 days ago.
The S&P 500 is DOWN -14.1% in December so far and Roebuck Systems AVERAGE return on 20 pairs is up 6.6%.
Since March 5, 2018 all 7 current groups are up an average of 89% while the S&P 500 is DOWN -12.3%. The combination of Inversely Correlated Pairs Trading, plus our Roebuck Systems Algorithms, continues 3 years of pre-published trades and 8 years of research, with these unequaled results.
Why trade only UP, when you can now trade UP and DOWN with 3x leveraged inverse pairs by using our unique short-term algorithms and daily trade signals.
In January, we will be offering all 20 Inverse Pairs, together with recent performances and ranking so that each follower can make selections according to their own preferences.
We will also continue to offer the Best 5 Pairs group which today has a profit of 159% since March 5, and an annual return of 197%. However, we do intend to avoid duplicate sectors within the 5 selections, to avoid extra volatility and short-term excesses.
All trades for the past almost 3 years have been published on the previous evening so that followers could place their orders at their convenience, before the next trading day opening.
Please check out our 30-Day Free Trial.
Ranking Inverse Pairs for Trading.
The pros and cons of ranking the best inverse pairs can work out well and offers some great potential.
To repeat a short history, followers will remember that we started with a concept to eliminate stock picking.
The first decision was to match a group of professional investment managers, using a scale of 100% to represent a combined best portfolio.
The second decision was to refine some algorithms that I was already working on to improve the decision of when to buy and when to sell individual stocks.
One of the earlier efforts that showed the greatest success was to work with volatility and an ETN with the symbol XIV. Unfortunately, Credit Suisse took that off the market.
Getting back to stocks, the next decision was to work with the Dow 30 Industrials, and we could combine them into a successful result. This avoided the stock-picking. We soon found that the algorithm was more important than the stock-picking as it led to a sort of the S&P 500, Nasdaq and Russell stocks, to end up with groups of 10 stocks producing exceptional returns.
The turning point was ETFs and the decision to get back to the original concept of no stock-picking. We found we could successfully correlate by about 90%, a set of 10 ETFs that would match those professional accounts.
Further progress came when we could avoid staying in cash after a sale, and instead, could invest in the opposite direction by buying the inverse correlated ETFs. In the recent past, investment managers have made the switch to ETFs and ETNs due to their efficiency and the reduction in management charges of up to 1% annually.
It is important to note that professional accounts that might be returning say 10% to investors, could be improved by using our short-term buy and sell algorithms. Further still, by adding the feature of trading in both directions, they could be improved even more.
This is where the algorithms provided their greatest contribution by having a strong bias to short-term. Inversely correlated and leveraged ETFs have substantial charges due to their daily re-calculation requirement to meet advertised leverage.
But our directional algorithms are fast enough to gain approximately 200% of the 300% offered by 3x leveraged ETFs. Our average length of trades is less than 10 days.
Finally, in January the results will all be available to subscribers. Stock-picking takes a back seat to the algorithms because ETF producers have eliminated the need to be a good stock-picker.
Owning a stock that is preferred by Professional Investment Managers is outdated by inversely correlated pairs of ETFs that can be TRADED in both directions and RANKED by recent performance by using a good short-term algorithm.
In January, you will have a choice of 40 ETFs sorted into 20 pairs of inversely correlated ETFs. It will include pairs for stocks, bonds and volatility. Recent results will be available along with a current ranking for each pair.
You can receive a 30-day Free Trial.
You can choose and invest in 1 pair or all 20 pairs.
You can choose amount to invest in each pair. Minimum suggested is $1,000 per chosen pair.
You can choose or keep your own Broker.
Suggested new broker could be Tradier at $3.49 per trade or Interactive at $1.00 per trade.
You will receive the daily Blog each evening.
and you will receive all buy and sell signals each evening to place orders for the next market opening with your chosen broker at your convenience.
Winning Trades versus Losing Trades.
I sometimes get questions when the quantity of losing trades is higher than the quantity of winning trades and it does look very odd.
The answer is that the average value of a winning trade is higher than the average value of losing trades.
It works out that way because we stay in winning trades but get out of losing trades ASAP. The algorithm bias trades more often but we get in and out quicker.
This makes sense and is the reason we recommend low commission Brokers.
Unfortunately, the markets have not cooperated with the Santa Claus rally this year. There was a time, when we hoped the political news was going to be limited to the Mid-Term elections, but time has proven us wrong.
Reasons for some good news. We almost completely depend on inverse pairs trading and will only offer inverse ETF trading from January onwards.
Looking at the numbers today, the S&P 500 is down -9.9% in December alone and we are only down -2.5% on all 40 ETFs or 20 pairs. This is the worst December since the Great Depression of the late 1920's.
The political news mostly in the USA, is affecting the world now and inverse pairs trading is a good place to be. Despite that S&P loss, our numbers for December are showing us better than even for the same period.
This precise evidence continues to show why our algorithms, together with inverse pairs, can change your risk profile significantly. Will it go up or will it go down? All our efforts have gone into making that decision and it comes back to that old cricket saying. Perhaps because I was born in the UK, cricketers who maintained a career average of better than 50 runs, are exceptional players but I fear that baseball may have overtaken the old saying somehow.
At any rate, (as an ex-cricketer who played for the Mexico City Cricket Club in the 1960�s), predicting the direction for tomorrow at better than 50%, became my goal over 8 years ago.
Commissions Count, as well as Service!
Are you paying $4.50, $7.50, $9.99 or are you still paying more than that?
I started with Merrill, Lynch, Pierce, Fenner & Smith because they would open an account with less dollars in the 1960�s even though commissions were enormous compared to today.
The internet brought all the online Brokers and Trademonster became a great site to trade options, especially with the Najarian brothers and their connections to the Chicago Bulls.
At some point, we each look at service and cost for various personal reasons.
We have no financial arrangements with any stock brokers other than having trading accounts and these comments are simply meant to be helpful.
With our current concentration on this new version of pairs trading, we did take another look at cost and service because we are trading more in both directions.
We have found Tradier to be a reliable and very easy site to deal with at $3.49 for each trade. On their own decision, with no kickbacks to us, they offered a $200 or 60-Day free trading to any of our followers with the code ROEBUCK200. They probable do this for other sources and are always pleasant to deal with.
Regarding cost, we have found Interactive Brokers to be both reliable and very inexpensive at $1.00 per trade. Their site is simple, once you have signed up and know your way around and our trades are always easy to place.
We have found Interactive slow in dealing with checks to open an account, so we always wire money to them and from them, which seems to work well. The price makes this international broker well worth figuring out for the savings. They also have an additional security log-in feature which seems like a good idea these days.
Up versus Down Yesterday.
Scary yes, but our algorithms did exactly what they are designed to do yesterday.
The VIX Volatility Index shot up; the markets all tanked, and we reversed enough to make a profit.
(blog continues below chart.)
Nobody knew if this would continue today and tomorrow but we ran our algorithms again last night and made our normal recommendations.
This is a good day to explain why we prefer inversely correlated pairs trades.
Why lose the opportunity to switch directions whenever the markets change and when you can stay in most of the year.
I used the word �scary�, because that is what happens when the VIX Index goes up. That is why we also call it the Fear Index, even though it can sometimes also go up with exciting positive news as well.
What the current zig zag and continuous high range volatility does to us, is mess with our short-term algorithms that are usually operating in historically trendy markets.
We know that the current news is full of major indecision around the world. Many countries have doubts about interest rates like us, Brexit votes, and prospects for the 2019 economy, not to mention our political problems.
This same volatility is likely to last a while longer, and our algorithms will keep adapting to history every day.
I need to remind followers that we will not be continuing with any stock recommendations in January. Pairs trading is the best use of our algorithms for the future and the reduction of risk is a major factor in this decision.
Our Back-Testing Charts.
Back-test charts show the results when using the current algorithms and applying them to the past 12 months. They will not match the actual results found on the Historical Data page.
Traders like to see these back-tests to show potential results for the future.
As noted on each page it says: �
1 Year Back-tests and Trading Log showing the potential for each.
Investopedia describes Back-Testing as follows: -
Back-testing allows a trader to simulate a trading strategy using historical data to generate results and analyze risk and profitability before risking any actual capital.
A well-conducted back-test that yields positive results assures traders that the strategy is fundamentally sound and is likely to yield profits when implemented in reality.
A good reason to look at back-test charts is to see how well they theoretically dealt with historical trends on all ETFs. In pairs trading there are 2 individual charts, one for the bullish ETF and one for the bearish ETF and they need to be reviewed together.
Of most interest to inversely correlated pairs trading is how quickly they can recognize a change in direction, and therefore maximize profits in both directions.
Volatility plays a large part in this change of direction and followers already know we constantly refer to the VIX Volatility Index. It has a large effect on short-term direction change due to its immediate marketplace influence around the world.
Changes Coming in January.
We will be publishing more information about the performance of all the ETFs that we follow in January. This will be a continuation of our move away from single direction investing.
As noted, our algorithms are well suited to inversely correlated ETF Pairs Trading, giving you the opportunity to trade in both directions without having to use the old short selling strategy.
The relatively new Inverse ETF Pairs offer the very latest in trading both directions of many sectors and indexes and extra profits can be made using our short-term Booster Algorithms.
Most short, medium and long-term trends benefit greatly from these algorithms as you switch within these new inversely correlated pairs of ETFs.
Using Futures and Futures Options, the producers of these inverse ETF pairs, simply build two leveraged assets, by using Call Options for the upward direction and Put Options for the downward or reverse direction.
The result is two opposing ETFs that trade in 100% opposite directions and you can buy and sell just like any other asset listed on the stock markets without Short-Selling.
The good news is our algorithms are developed to tell you which direction has the most potential for the next trading day. You can then place your trades at any time in the evening for tomorrow's market open price.
With an average signal of 60% to 70% correct direction, you now have the added benefit of being invested almost all year, rather than only those days that the markets may be going up. For those down-days, you will be in the opposite side of the ETF pair.
If the algorithms are unsure of the potential direction when a change is indicated, you will receive sell signals for both sides of the pair and will remain in cash.
We highly recommend Interactive Brokers with a trade commission of $1.00 per each trade. We have no financial connection with any Broker. We also trade with Tradier where their commission is $3.49 for each trade and they do offer $200 or 60 days of free trades with the code ROEBUCK200.
Energy Just Not Cooperating Today.
The daily fluctuation in the price of a barrel of oil is not currently cooperating with our algorithms. On the day we sold the long side of oil and bought the short side, we get reporting that oil prices are tightening.
We were on the wrong side today and we expect to get reversals again tonight.
We do not depend entirely on intraday news reports, but it is also reported that $50 per barrel is close to the cost of production in our part of the world. That unfortunately does not guarantee that we are at the lows and about to see higher prices.
As previously reported, we are making changes in order to minimize the inclusion of multiple pairs from the same sector in our Best 5 Pairs group next month. We will stay with the current group and expect lots of volatility before December 31.
You could decide to drop either OILU/OILD or UWT/DWT from the Best 5 to stay away from these reversals or you could drop them both.
I will stay with them because we have made $3,503 on $2,000 with the OILU pair with 14 round trades. We also made $3,484 on $2,000 with the UWT pair with 39 round trades. These numbers are since March 5 this year.
Review the Individual ETF Graphs.
We could have used SOXL and SOXS which do less trades per year -
Review the Individual ETF Graphs.
On the 5 Best Pairs page of the website, look at the first chart and graph for the ETF, OILU and notice the way the green algorithm line performs relative to the red dotted OILU actual history line.
Both start at 0% in order to demonstrate their relative performance.
The reason we call our algorithms � Boosters � can be seen from this chart.
While the ETF goes up to 110%, the Booster goes up to 270% and then as the ETF goes back down to minus -40%, the Booster finishes the year at 200% profit.
Now look at the next chart for OILD. While the ETF wanders down to -70%, the Booster manages not to lose money, and then as the ETF recovers to minus -20%, the Booster shoots up to 180% profit.
If you add the 2 sides of these back-tests, you have a potential 200% + 180% profit or 380% total profit. This represents the perfect buy and sell dates for approximately the last year for both sides of this pair.
If you look at current day back-test expectations for this pair on chart 1U (below), using algorithms indicates a combined number of approximately 157% + 224% or 381%. Somewhat the same as the individual back-test charts that were produced at the end of November when published to the website.
Here are all the results together.
Original Theoretical Back-Test = 380%
Current Theoretical Back-Test = 381%
Actual Annual Profits = 248%
Algorithm performances = 248/380 = 65%
In this case, we are making approximately 65% of the original back-tested potential profits from this pair of algorithms when applied in real life and real time. Commissions are not included in these calculations and we use and recommend Interactive Brokers at $1.00 per trade or Tradier Brokers at $3.49 per trade.
We have no financial agreements with these brokers but Tradier offers $200 or 60 days of free commissions for new accounts using the code ROEBUCK200.
We made all the above calculations for inverse pairs trading as we built and developed the algorithms. They are deliberately designed for short-term decisions to buy or sell at the earliest market open (tomorrow) as opposed to live intra-day trading.
Hope this helps to see how the process develops over time.
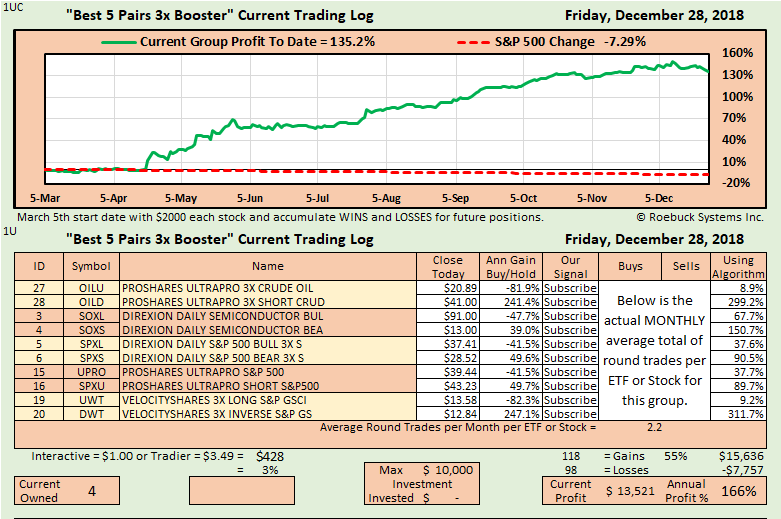
OIL � Benefits and Complications.
1 OILU-OILD Proshares 3x Crude Oil.
2 UWT-DWT Velocity Shares 3x Crude Oil.
3 UCO-SCO Proshares B�berg 2x Crude Oil.
4 GUSH-DRIP Direxion 3x Oil Services.
7 ERX-ERY Direxion 3x Energy.
These 5 energy related ETF pairs hold the top 4 plus the number 7 profit positions from our 20 current Inversely Correlated Pairs from trades since March 5, 2018.
Volatility on Steroids
The following graph shows what happened to oil prices since Oct 3, 2018.
This chart shows you how oil prices moved pre-election and afterwards as well as illustrating how the inverse pairs can make profits in both directions.
We mentioned yesterday that volatility, when married with huge sector price disruptions, is not always a benefit. The speed of the reduction probably had some political bias from one or more of the oil producing countries.
In future, we are working towards a more effective way of grouping the limited sectors of ETFs that are available and here is a list of sectors with quantities.
1 Biotech
1 China
1 Dow
1 Emerging Markets
5 Energy
1 Nasdaq 100
1 Russell 2000
1 Russia
3 S&P 500
1 Semiconductors
1 Technology
1 Treasury Bonds 20 Year
2 Volatility
Our 2 Investment Manager groups of 10 bullish ETFs and 10 Inverse Pairs, represent 10 of the above ETFs that, as close as possible, correlate with their professional world-wide portfolios.
The remaining 10 ETFs are represented in our Mixed groups but do not represent any logical or professional selection and can have greater volatility.
In January, we are likely to prevent the Best 5 Pairs group from concentrating too much in a single sector such as Energy or the S&P 500.
Our concentration on inversely correlated pairs has been highly successful but there are less than 30 inverse pairs that meet our needs. With the rapid growth of ETFs in recent years, we expect choices to increase.
All Hitting the Fan Today.
Volatility started back up again today and the pattern we have recently emphasized wants to continue a while.
Using leveraged ETFs increases the daily risk levels substantially and followers may much prefer moving to cash temporarily. We will continue in our own accounts.
It is impossible for any of us to miss our daily news but the Brexit vote in the UK and riots in France are not going away either. China also has economic troubles.
The certainty of world economies needs greater predictability and stability and day to day volatility needs to slow down.
John Harwood said it best today when he noted that everything is hitting the fan at the same time.
What we saw in our own election during September through November has evolved into some solutions on January 3 next year.
The Brexit vote in the UK was pulled today for further consideration.
Two months ago, oil was at $76 per barrel and today it is at $51 per barrel. The opportunistic fuel tax in France has been pulled but with continued riots. We also have Russia plus 4 pairs of leveraged oil ETFs and avoiding these would limit much of the daily volatility.
Chinese markets down 25% due to the tariff policy and now the arrest of the Huawei executive and family member in Canada at the request of the US.
Options values create the leverage in ETFs and the above reasons are likely why volatility is trading in a much higher range. Each problem will be resolved and options and then leveraged ETFs will return to average trading ranges.
Volatility always eventually returns to its annual average value, but it reflects uncertainty. Once we can all be more certain of the future trends, we will return to historical norms with an extra day or two in those volatility trends before changing direction.
No Relief Yet After Elections.
The following chart shows the VIX Volatility Index from July onwards with the trading problems starting on October 4 and they continue to this day.
The financial projections as well as the political news are affecting huge populations in opposite directions.
(blog continues below chart.)
Alternating good and bad economic news are now thought to be shorter-term for 2019 rather than longer-term into 2020�s.
Can we please get a trend like the one before the October Troubles? With pairs trading, we need a turn-up or a turn-down, but not a constant turn like this chart.
Due to our graphs following 5 or 10 pairs of ETFs, with each group in alphabetical order, our results show profits that are spread out and steadily pointing upwards. The slope has lessened by this day-by-day volatility, but profit levels are still substantial.
We could quantify this type of volatility and cause more sell signals to avoid similar activity but that would also negate other factors and changes are not indicated at this time.
Results of our short-term algorithms have been very positive for 3 years now and do not justify any current changes. This second chart showing 10 years of volatility history, helps us in the decisions whether to make changes. Note that steadily trending volatility is not necessarily an enemy of our algorithms.
We added the 2 volatility pairs to our larger groups in December because they are often used as an alternate or as a hedging vehicle by some investors. Individuals may have your own reasons for including volatility in investing decisions.
We continue to run the VIX Index itself through our algorithms and publish it daily, even though it can only be traded by derivatives such as ETFs, Futures and Options.
An Interesting Question.
Are the BUY signals good or bad today? The answer is always easy at the end of the day but the day before is also easy.
Each decision on the previous day, will be approximately 60% to 70% correct. However, when we send out the signals, we do not know which future days will be correct and which will be wrong.
Our algorithms will basically get you into an ETF and get you out of the same ETF with a continuing degree of accuracy.
They will also keep you in longer and get you out quicker when you are losing value.
The great benefit of our algorithms is after they get you out of a losing trend, they will decide, with 60% to 70% accuracy, when to get back in or when to stay out.
Now, we must talk about inversely correlated pairs trading, because when an algorithm tells you to get out of an ETF, it often tells you at the same time, to get into the opposite side of that pair.
If, for some reason, it is not sure which direction to tell you, it will keep you in Cash until a decision is made.
I strongly recommend that you consider trading inversely correlated ETF pairs from now on, but I also recommend that you invest in a minimum of 3 pairs and you paper trade them for 30 days, FREE.
I hope you will then see how simple it is and how successful it can be for you.
More Info on Blog from Yesterday.
Said another way: -
Since March 5, 2018 starting with $2,000, while the markets were going UP, we made $937 or 47% in SPXL and while the markets were going DOWN, we made $1,457 or 73% in SPXS. In total 119%.
Equivalent to an Annual Profit of 159% from both directions.
Get Involved in The New Pairs Trading.
This New Pairs Trading world is probably new to a lot of followers and here is how it all works.
We will use the example of the S&P 500 Index which represents a broad range of the USA Stock Market.
A company called Direxion has produced an asset under the symbol SPXL which represents all 500 of the index stocks.
However, by buying a selection of stock-OPTIONS instead of buying the stocks themselves, their new SPXL will move three-times faster than the S&P 500 Index.
How do they do that?
Option contract values on stocks move at different speeds, depending on the distance that the OPTION strike price, (or contract price), is away from the current stock price. It also depends on the time left until the Option contract expires.
So, after the markets close every day, Direxion re-calculates which new selection of OPTIONS they need to own, so that SPXL will move three-times faster than the underlying Index. This means that at the BEGINNING of each day, SPXL will move three-times faster than the underlying S&P 500 Index.
We now have an ETF (Exchange Traded Fund), that we can BUY and SELL, that will move much faster than the underlying Index, simply using option contracts rather than using the stocks themselves. By using CALL OPTIONS, if the Index moves up $1.00, SPXL will move up $3.00.
The New Inversely Correlated ETFs can now be created to move in the exact opposite direction to the above SPXL, simply by using PUT OPTIONS instead of using CALL OPTIONS.
Direxion also creates SPXS which moves in the exact opposite direction to SPXL.
The key advantage of this new Pair of assets is if you think the market is going UP, you would BUY SPXL but if you think the market is going DOWN, you would BUY SPXS.
In one day of trading, if you owned both SPXL and SPXS, you would end the day with approximately no difference because one of them will profit and the other will lose the same amount.
As we say, you would be HEDGED with no gain and no loss.
Our algorithms are solely designed to predict which direction is likely to be correct on the next trading day. We have a published historical record of being as high as 70% correct for some periods and therefore, our signals will inform you whether to buy SPXL or buy SPXS. In either case, you will make a profit when the direction is correct.
Since March 5, 2018 starting with $2,000, we have a profit of $937 or 47% in SPXL and $1,457 or 73% in SPXS. This is a total profit of $2,394 in 274 days on a $2,000 investment or 119% current profit. This is equivalent to 159% Annual Profit, all from the same $2,000.
Sometimes Things Just Work Out.
Algorithms don�t always make sense but especially this morning, things just seemed to work out great.
For example, an addition to the Best 5 Pairs for December was OILD and last Friday, it closed at 42.29 when we signaled a new Buy for Monday open.
Well, it opened at 36.14, down 14.5% and that is where we bought it.
Now that will either be a disaster and keep moving down, or a brilliant decision. At least it started back up in the early morning. Algorithms can surprise us, and you will see more days like this. Why?
The answer is in some calculations. We all tend to look at the LAST price to see our values, but the algorithms can only use the LAST price one time. History is always written as the Open, High, Low and Close, and the LAST is not important before today.
The LAST is a problem today because yesterday, it becomes the Close but until trading finishes in the after-hours today, the LAST keeps on changing.
In fact, we often quote slightly different prices to your prices when we publish data in the evening because the LAST changes until after-hours finishes and it becomes a new number when the markets open tomorrow.
Simply put, our algorithms rely on the Open, High, Low and Close for all of history. The exception is just me, because I still watch all day long for the sheer exhilaration and then place my orders the same way you do. At my leisure in the evening or in the morning when I forgot.
The Best 5 Pairs also now includes UWT/DWT and DWT was a buy from 28th November. Based on the rules, we also bought it this morning.
On Friday, it closed at 13.78 and opened today at 11.79, down 14.4% and that is where we bought it. It also started back up immediately this morning. Will that also be a disaster or a brilliant decision?
It seems that our algorithms liked making money while oil prices went down, and they are preparing us for the possibility of oil going back up. That is why the new inverse pairs trading is the new magic � if you have some good algorithms.
For the record, OILD closed at 36.28 and DWT closed at 11.82. Small profits were made on both.
Changes for December.
I am pleased with these anticipated changes mainly because we have good reasons for all of them.
There are unlimited opportunities with inversely correlated ETF pairs, but I repeat that there are less than 30 of these pairs that meet our volume and algorithmic requirements.
First, we have two switches. SOXL/SOXS switch from the Mixed groups to the IM groups and UCU/SCO switches from the IM groups to the Mixed groups. If you own either of these, you could wait for a Sell signal to keep your group identity. Note that all history follows each ETF to either their new positions or is dropped or added as noted.
Next, we have some more interesting switches. We have decided to move the Volatility Pairs into the main groups. UVXY/SVXY moves to the IM groups and VXX/ZIV moves to the Mixed groups. Volatility has become an important sector and we like it as a partial hedge and for the diversity it offers.
To make way for these two volatility pairs, we are removing Gold as none performing pairs for us in recent times. We drop NUGT/DUST from the IM groups and JNUG/JDST from the Mixed groups.
Finally, you will see that TNA/TZA has been dropped and replaced by UWT/DWT in both IM professionally selected portfolio groups. That is the Bullish only group as well as the Pairs group. As usual each month, we change our Best 5 Pairs group based on recent performance, and you will see improved past performance and potential in the December selection.
It is our intention to eliminate individual stocks, probably in January, and we urge followers to switch to a pairs group before that happens. We will keep the same 5 Stocks for December in the Best 5 Stocks group for your convenience.
Clearly, you have seen our gradual shift away from single direction groups, towards the more successful inversely correlated ETF pairs. Our algorithms are ideally created to this new way of trading pairs and offers much higher returns while reducing risk to a new minimum level.
By reviewing all past performance, this new risk level appears from these graphs, to approach zero in a very short time.
This ETF market of 100% inversely correlated indexes and sectors deserves every investors attention. When you combine them with our short-term algorithms, it creates opportunities that have never been available before their existence.
With our average holding periods of about 10 calendar days or 7 business days or less, we can outmaneuver the leveraged ETF rolling management costs.
On average, from the 3x leverage, we take more than 200% of their 300% daily promise, and then get to switch trading to the opposite direction with similar profit potential.
I hope these small changes work well for you in December and we all get that Santa Claus rally that is so often predicted.
Post-Election Sign-Ups.
Great to see that followers are also seeing the benefits of post-election results. We seem to be back on better trajectories per comments received. Instruction signals are sent out every evening.
It was frustrating during the run-up to elections and I must admit that the best news I received was during my preparations for the November groups.
I learned that some major portfolios were also having unexpected results from their algorithms. Their advantage in this case was their use of non-leveraged ETFs or ETNs. They were also experiencing changes out of tune with normal performance. I very much appreciated their comments.
I know that some of what we do seems difficult to follow at first and we produce a lot of data and charts that may be an overload. We feel a need to explain all of this information.
But it really is simple to duplicate our results in your accounts and to follow the basic principles behind our algorithms.
First, our algorithms are concentrated on direction for tomorrow only and repeated daily. That was my first thought and goal some eight years ago.
Second, although we began with volatility, we found them to be ideally suited to the growing Exchange Traded Funds market as well as stocks.
Third, is the rapid growth of inversely correlated ETFs and our ability to switch 100% to the opposite direction very quickly.
Fourth, our short-term algorithms having average holding periods of less than 10 days, and being able to take advantage of leveraged ETFs that have high daily management costs.
RESULT: - We trade fast moving leveraged ETFs almost 100% of the year in whichever direction they move.
Switching Stocks to ETF Pairs.
One of our trading accounts follows the Best 5 Stocks and we have decided to switch it to the Best 5 Pairs 3x.
As we get sell signals for the 5 stocks in the current Best 5 Stocks group, we are making new buys from the Best 5 Pairs group.
It makes no sense for us to follow a group that does not allow trading in both directions. Every month, as we refine our groups, the results hammer home the ability of our algorithms to operate very successfully in the non-leveraged or leveraged inverse ETF pairs market.
Periods of negative markets are not going away and although the algorithms can get us out of a stock position, that is only half the story.
We can go to cash or borrow stock and short sell it. The better alternative is to trade assets that have equal assets that move in opposite directions.
Admittedly, we rely on algorithms that can reverse directions. The first group that we published was created with non-leveraged inverse ETFs, but they also correlated with Investment Manager portfolios, leaving the stock picking to those professionals.
We quickly found that the short-term design of our algorithms worked equally well with 3x leveraged ETFs that lose value daily due to rebalancing after every market close. Our average holding period has historically been less than 10 calendar days or approximately 7 trading days.
With the growth of the ETF market, it is difficult to find a professional investment portfolio that does not contain some ETFs. If you need the proof of this, check out the ownership and volume of the Vanguard Total Stock Market ETF with the symbol VTI. It trades half a billion dollars every day and many portfolios include it.
Holidays and Elections.
We are pleased to be putting the political gyrations behind us for another two years (we hope). Elections cause unusual changes and decisions by sectors of the investing community.
I call it harmonics getting out of whack. Everything from the news cycle to each individual investor is affected by expected results, causing perhaps 50% of them being happy and 50% on the other side.
It gets wider coverage with instant news around the world and we see the effects on algorithms, as do the large portfolios that also use some algorithmic trading.
Our main example was the Brexit vote in the UK which was a complete overnight surprise and shock to most world markets. Any world event that has large financial implications can occur at any time and it is impossible to predict them.
However, election results drag out longer than most events and the uncertainties build to a climax. Six weeks may be a good period to work with and perhaps we should all take a vacation or move to the sidelines in future.
Known blips also affect algorithms and these can be the 9 weekends or 1-day holidays observed by the New York Stock Exchange. We have noticed increased direction switches at those times and many of them move back again within a few days. These quick switches seem to go by with little financial affect and deciding which and when and how to program them would be difficult.
This all fits my description of short-term changes in the harmonics of the market. These zig-zags in the markets and sectors play a small part in the overall trends with the possible exceptions being elections and other large world events.
It gives me more faith in our short-term algorithms and especially in our concentration on inversely correlated pairs of ETFs.
Professional Investment Managers II.
We expect to make small changes in our Professional (I)nvestment (M)anager pairs group of 10 correlated ETFs as well as our Mixed pairs group for December.
As always each month, we recommend selling any discontinued position and buying any other ETF that has a buy signal.
(blog continues below chart.)
Changes usually occur slowly in these groups, unlike the Best 5 Pairs which can have several changes each month.
Also, it is important to know the full concept of the IM Pairs 3x group. The full 10 positions correlate to professionally selected world-wide portfolios.
We determine the various percentages of stocks and bonds etc. that are held in these professional portfolios and then select 10 leveraged pairs of ETFs, which we review each month. Our IM portfolio is then matched and correlated by roughly 90% to their professionally selected holdings including fixed income.
As near as possible, we select ETFs that hold stocks from American, MSCI EAFE and Emerging Markets, plus fixed income and specialty markets so that our IM (Investment Manager) portfolio represents a broad professional range. The above chart breaks down the distribution of EAFE stocks, otherwise known as Europe, Australia and Far East countries.
We have previously described how our unique short-term algorithms typically produce approximately 200% or more of the 300% that 3x leveraged ETFs offer, mainly due to our average short holding period of less than 10 days.
This overcomes the daily roll-over expenses incurred by leveraged ETFs and allows us the additional profits on top of the algorithmic directional profit produced by Inverse Pairs Trading.
You should plan on holding one side of all 10 pairs in equal dollar amounts if you wish to replicate these IM professional portfolios when there is a BUY signal for one side of each pair.
It is possible that one or more of the pairs will have 2 SELL signals because the algorithms are undecided for the next trading day. If you are trading the full 10 ETFs, you will hold approximately 10% of your account value in CASH for each undecided position until one side of that pair gives a BUY signal.
Following an exact match to the Investment Manager Portfolio is the only case where you would equalize your investment in each of the 10 ETFs. Otherwise, you may wish to accumulate profits from one buy to the next, as we do in our history charts.
In all future trades, you will not be required to hold both sides of any pair. This allows you to plan for each 10% of your capital to be allocated to each of the 10 pairs and will only be in CASH during the short undecided periods.
Now changing the subject away from Investment Managers, the Mixed Pairs 3x and the Best 5 Pairs 3x are created from additional ETF pairs but do NOT represent any predetermined professional selection.
The Mix 10 Pairs 3x group is made up of some remaining viable pairs that perform well with our algorithms but may have duplicate underlying assets such as the S&P 500 Index or Energy. They can be followed independently or as a group and we make no assertion, other than their past performance and future potential, that they are matched in any way.
There are a limited number of 3x leveraged pairs to work with and we make our selection based on volume and viability with our algorithms.
Our Best 5 Pairs 3x group closely follows performance during the preceding period and can be followed independently or as a group of 5 representing 20% of assigned capital to each of the 5 pairs.
Similarly, the Volatility Pairs consists of only 2 available pairs that operate uniquely with their own dynamics and often provide a much different cycle to the general market indexes.
Concentrating on the Highest Profits.
We have always relied on Professional Investment Managers to do the stock picking because they have so much more knowledge to offer their clients.
Recall that our first group of 10 ETFs is about 90% or better correlated with their portfolios, including fixed income alternatives.
Results from this group are on the conservative side but probably offer the least risk. Initially, we had more stocks in our offerings, but the picking was mostly based on recent performance.
It soon became far more beneficial to use 10 inverse sets of paired ETFs for our Professional portfolio because our algorithms are uniquely designed for short term next-day direction finding.
This step allowed us to profit equally in up or down markets for the very reason that our algorithms were primarily designed for them. At the same time, the new inversely correlated ETF pairs, have taken over the marketplace and eliminated problematic short-selling approaches to reversals and hedging techniques.
The later growth of the leveraged inverse pairs has overtaken our non-leveraged base portfolio because our algorithms are faster than the rolling daily losses caused by the leverage. Simply said, using underlying options versus using stocks, quickly loses time value.
Where we could initially increase professional portfolios from say the 10%-12% profit range to 25%-30%, by trading in both directions with 3x leveraged ETFs, we can almost double the return to the 45%-60% range. (See IM Pairs 3x group)
Now comes the leveraged ETF bonus. Using 3x leveraged ETFs, we can squeeze another 225% from their 300% leverage. We have lots of history demonstrating that for every 1,000 trades, we hold positions for less than 10 days.
This algorithmic gain gets our pairs trading to over 100% annual profit from markets that we have experienced in recent years.
A note of caution. In our opinion there are currently less than 30 inversely correlated pairs with enough volume and history for us to consider.
Beyond our 10 Investment Manager 3x pairs, we have used up another 10 viable pairs in our Mixed ETF 3x group. They do not represent any developed portfolio but strictly due to our ability to trade both directions, they perform well.
By adding the 2 pairs of inverse Volatility, we get to 22 total pairs that we can offer in our groups. We add to that, the VIX Volatility Index which cannot be traded by itself. We do generate VIX buy/sell signals for traders of various other derivatives for information purposes which may help their trading decisions.
Recognizing Natural Progression.
After completing the Blog comments yesterday, I looked at the ranking charts and probably should have included some comments about them also.
Pairs trading groups rose to the top 4 ranking positions yesterday with an average annual return for all 4 of 112%.
(blog continues below chart.)
The remaining 3 single direction bullish groups took up the bottom 3 ranking spots, with a very respectable average annual return of 44%.
One reason for this was the recent gains in the Volatility Pairs which jumped to an 84% annual return for the last 260 days.
I was pleased to see the volatility pairs performance, especially because it has been a favorite of mine for some time.
Volatility algorithms present a totally different set of problems as well as opportunities when writing algorithms and I certainly hope to keep them in our pairs trading groups in the future.
It should be noted that they do not have the 3x leveraged pairs that we otherwise would use but that does not take away from the wide interest in them by many traders and hedgers. UVXY has some limited leverage but they do have large moves at times.
Volatility has the unique characteristic of always coming back to an average annual value and can never go to zero. It could make a new high but would quickly come back down towards the average.
Some other ETFs tend to have apparent limits. For example, gold and currencies are unlikely to go to zero and perhaps have limited ceilings but stocks have few constraints at all.
I like to think of other advantages we have in using our unique short-term algorithms. There is not much competition knowing short-term potential direction ahead of time, but many investors are using some form of technical analysis or fundamentals in their stock picking.
Professor K C Ma of Stetson University warns - "The rare success of the leveraged ETFs also require the investor to have precise short-term market timing ability."
He is absolutely correct, and we have it!
Best 5 Pairs Versus Best 5 Stocks.
You can see very well from chart 1x that the Best 5 Pairs outperform the Best 5 Stocks in these 2-way volatile and politically unusual markets.
We have talked about inverse pairs trading a lot lately and have already moved to 90% ETF pairs versus just 10% plain Stocks. Short selling stocks is available but we much prefer our algorithmic inverse pairs trading today.
(blog continues below chart.)
Investing is making that decision whether you buy or sell and when to do it. Our algorithms make that decision for us and advise us into the best potential direction whichever ETFs are chosen.
As you already know, our uniquely short-term signals from our algorithms operate very well in pairs trading and have been effective in the current environment.
They seek to tell us directional change as well as the continuation of trends on a daily re-calculated basis. The markets since the start of the current sessions last March has had trends as well as abnormal volatility due mainly to elections and unusual political news.
Mathematical algorithms come in various types, but short-term direction is proving to be successful throughout this period and there is no reason to think things are about to change.
We are already hearing doubts about the possible length of prosperity following the supposed all-around benefits of the recent tax-cuts. Debt and interest rates are front and center for many financial outlets.
The market benefits anticipated by stock buy-back programs this fall may not carry through next year as projected, and we believe that short-term direction algorithms will continue with great longer-term performance that builds on their short-term ability.
Your clue to all this evidence can be easily followed from the ranking charts that we publish every evening along with the History Data page of all actual trades on our website.
Leveraged Inverse Correlation.
The history goes back several hundred years to Edward Lloyd and his London coffee shop in the 17th century.
Being a favorite gathering place for sailors, the conversation often related to what happened to ships lost at sea.
Some of these wealthy coffee drinkers joined forces to provide payments to ship owners who lost ships and cargoes.
Insurance was born for the owners who were STRICKEN by these losses. This is a long way around to explain a STRIKE price on an OPTION if your ship is lost at sea.
These coffee drinkers also invented the Chicago Board Options Exchange, but they never knew it.
If you own a ship worth $100, (we will call it a canoe), you could earn extra income by writing a contract on your canoe that reads � Before the third Friday of December, you can buy my canoe for the STRIKE price of $110 for a fee of $5. You will make $5 on a $100 asset or 5% profit.
Nobody is going to buy your canoe unless the market price goes up before the EXPIRATION date. If the value goes up to $120, someone will pay you $110 and immediately sell it for $120 and make a $10 profit.
Everybody wins something. You were paid $110 for a canoe that was worth $100 plus $5 for the December contract and for every month you write a similar contract. A good income for your Pension Plan is selling CALL OPTIONS against your assets.
The buyer also made a nice profit. He leveraged his $5 and made 100% profit but would lose his entire $5 if the contract expired below the $110 STRIKE PRICE. However, he could also repeat this every month.
Imagine a world where this same ship (or canoe) might go down in value and you want to buy a canoe at a lower price. You might write a contract that reads � Before the third Friday of December, I will buy a canoe for a STRIKE price of $90 and will pay $5 for this OPTION contract.
Again, nobody is going to buy a canoe unless the market price goes down before the EXPIRATION date. However, if the value of canoes goes down to $80, someone will pay $80 and immediately sell it to you for $90 to make a $10 profit.
Everybody wins again. You paid a lower price of $90 for a canoe but you also received an income of $5 and maybe additional income for every month that you wrote contracts that were never exercised.
A CALL OPTION is sold by you if you own a canoe and are prepared to sell it for an agreed higher price by an agreed date.
A PUT OPTION is written by you if you want to buy a canoe and are prepared to buy it for an agreed lower price by an agreed date.
Non-leveraged ETFs are like Mutual Funds. They represent stocks or other assets that move up or down according to the underlying market value. It can own or represent stocks and shares (and canoes) at their current market value.
Leveraged ETFs represent OPTIONS on those same assets that increase or decrease in value at a much faster rate. The difference is that owning the underlying options creates greater movement and higher daily risk. Additional losses are incurred every day because these ETFs require daily adjustment of all the OPTIONS to maintain the published leverage at the start of every trading day.
Leveraged ETFs that move in opposite directions can be achieved by using underlying PUT OPTIONS or CALL OPTIONS. These pairs of resulting ETFs move in the exact opposite direction at different leverage amounts. (Think 100% Inversely Correlated Leveraged ETFs!)
Our algorithms quickly define the potential direction of ETFs and can raise profits by trading inverse pairs of ETFs in both directions as opposed to only trading in a single direction and then holding CASH.
Remember, you can CALL him up or PUT it down.
The Logic of Pairs Trading versus Stocks.
It is no accident that our pairs groups have found their way to the top of the 1X ranking chart and the bullish groups have moved to the bottom.
Three years of giving trades ahead of time, has shown that our algorithms can exclusively operate in both directions.
More important though is their speed and ability to overcome the rolling daily capital losses that occur with these 3x leveraged ETFs but more about that later.
With stocks or non-paired ETFs, we only trade when they are going up and must stand in cash when on the way down.
Our focused algorithms make it possible to trade almost continuously, now that we have ETFs that go in both directions and even better, leveraged ETFs in 100% correlated opposite directions.
But using options to create the leverage costs large management fees. For example, SPXL, which follows the S&P 500 Index, has average five-year management losses of about 280% in recent years.
That is close to 1/4% for every trading day in the last 5 years. Our average ownership is for 10 calendar days or 7 trading days. This averages out to about 1.75% of management costs for each trade.
That is precisely our advantage. Our algorithms are selecting the periods when the underlying asset is expected to move in a profitable direction and they are taking advantage of the 3X leverage.
We calculate we are getting about two-thirds or about 200% of that underlying 300% leverage that these ETFs are geared to move every day.
Pairs Trading the Roebuck Systems Way.
Our new Pairs Trading using Inversely Correlated ETFs needs more explanation.
Prior to ETFs, 2 types of trading were available. The first was a combination of a pair of long positions and making profits from the price differences as they moved apart and back together again.
Hedging is another way of thinking about this method of trading which profited from their differences in price over time.
The other type involved buying when the stock was moving up and then selling it SHORT when the stock was moving down. Now see how we improved these trades.
Primarily, our algorithms are very short term oriented and can quickly see a potential change in direction each day. These mathematical algorithms concentrate on tomorrow and then recalculate each following day.
Secondly, the new ETFs (Exchange Traded Funds) that replace many Mutual Funds, are uniquely available in pairs. One side of the pair is created to go up with the underlying assets and the other is created to go down (in precisely the opposite direction).
This means at any time of day, you can buy a fund (ETF), that is either going up or going down in the opposite direction at the same time.
So, when we combine our algorithms with these inversely correlated ETFs, they make a profit in both directions by buying which of these directions they are signaling for tomorrow.
Let me repeat that. Our daily algorithms select the direction with 60% to 70% accuracy, and you invest in whichever side of the pair is currently signaled and no short selling is involved.
We specialize in these new inverse pairs of ETFs specifically because our algorithms have this ability to quickly define the potential direction each day and we send this signal to you each evening. If a change is signaled, you can then place an order at your convenience, before the markets open tomorrow morning.
Sometimes, they will tell you to sell your existing position and do nothing. This only happens if they are unsure of a change in direction. Other times, they may tell you to sell your existing position and buy the opposite direction.
Just remember that these ETF pairs are inversely correlated to move 100% in the opposite directions at the market opening tomorrow. We recommend you take the signal on the first day that you see the change, but it can be taken anytime.
Low Online Broker Fees.
I often mention Broker fees because the availability of lower trading commissions continues to be available to all of us.
We maintain accounts at Tradier and Interactive Brokers and have used others but the current trades that we publish have all been based on Tradier who currently charge $3.49 per order.
We have no arrangements with Tradier, but they do offer new accounts 2 months or $200 of free commissions with the use of the password ROEBUCK200.
Interactive Brokers is cheaper at just $1.00 per trade and they have a free trial.
As mentioned, we have no financial relationships with either of these brokers other than our own accounts, but we can recommend them both.
I have to say that Interactive is a much more complex site and offers a variety of trading accounts around the world but our trades are very simple and straight forward for any platform.
Our algorithms are short term with an average hold time of 10 days or less. This unique feature provides the opportunity to trade leveraged ETFs with higher results. The average annual profit from 7 programs is currently 85% with the highest annual profit at 168%. Average brokerage fees are under 15% with Tradier or approximately 4.3% with Interactive Brokers.
Many times, you will have your own preferred broker and the above commissions will allow you to estimate your own fees.
Some Days Look Really Good.
After all the election-type of volatility in recent weeks, we are looking for normal times and maybe yesterday was it.
After a few days of revival and position changes last week, we ended up with the trifecta of short positions in Oil and the S&P 500. They went up an average of 5% each and gave our Best 5 Pairs and IM Pairs groups a nice boost.
This is where algorithms require a change in thinking from my old way of looking at things. Both SPXS and SPXU agreed that the S&P 500 was going to go down but why did Crude Oil and SCO, continue the trek down from $39 to almost $23.
The news is that crude was down around 20% for a record 11 sessions in a row and settled at $59.93 per barrel or the lowest active contract price since February.
Now, I am sure that there are some followers who would be following crude oil prices and probably knew it was going down for another day, but I probably would not have taken that trade.
The interesting point is that all three of these positions are part of our Professional Investment Manager selection which is the matched and correlated portfolio of leveraged ETF Pairs.
It serves as a good indicator that this monthly portfolio includes a range of assets that a broadly-based investor could or should be thinking about. The portfolio also includes a range of stocks and was currently also invested in 20-year Treasury Bonds since Friday.
It is sometimes handy to see that this balanced portfolio of 10 pairs is bullish on treasury bonds and bearish with 9 short ETF positions. Sometimes there are messages in those selections, I think.
The maximum holding to follow this Pairs Investment Manager group is 10 ETFs and normally there would be a variety of long and short positions.
If you follow just the IM bullish portfolio, then you could have from 1 position, (as we currently have in bonds) or up to 10 ETF positions.
The reason that I like the Investment Manager match approach is their ability to look at all investment opportunities. They have a combined knowledge of stock picking that I could never have.
By Way of Explanation.
About 3 years ago when we first went public with our algorithms, we had a simple problem and we had to make a simple decision.
Because our algorithms worked well with ETFs and Stocks, we were able to list everything in alphabetic order. This worked well until we found how well they worked with inversely correlated pairs.
First, bullish ETFs are not always in alphabetical order with their partner bearish ETFs and second, when we buy ETFs in date order, we do not sell them in the same date order.
The decision we made was to list all single direction bullish groups of ETFs and stocks in alphabetical order and that solved most of the problem.
With pairs trading groups becoming our most popular and successful selections, we must list the pairs together. Here, we decided to list the pairs with the bullish ETF in alphabetical order and the bearish ETF listed next to it.
Finally, as we list and build the history of the trades in the various groups, we had to follow each ETF and Stock in alphabetical order to show the sequence and performance of each individual asset. To do it any other way would make it less transparent and almost impossible for anyone to follow.
This has occasionally received some questions and I hope this explains why it became necessary as a part of our reporting.
The main casualty of having to report this way is the first few weeks of the graph that can look a little odd but in the long run, a gradual move showing profit or loss generally balances out any differences.
How we Select the Best 5 Pairs Group.
First is a unique set of 10 inverse pairs that we match and correlate to world-wide Professional Portfolios. This IM group represents a well-balanced selection of world-wide investments including fixed income and bonds.
Next, we select a second set of 10 high volume and popular inversely correlated pairs that perform well but do not represent any unique portfolio choices.
Our final 2 pairs are related to the volatility market and are derivatives of the CBOE VIX Volatility Index. That is 22 inversely correlated matched pairs: - 22 bullish ETFs and 22 bearish ETFs.
The attached Chart called RANK includes all 22 of the above pairs and we look at the recent performance and can rank them in order of actual current profits from our algorithms. All this information is also included and available to subscribers on their SUB chart (thanks to Enzo) so that they can put their own list together.
Yesterday, we described more details about this relatively new method of pairs trading with inverse correlated ETFs instead of using the complex short-selling process that was used previously but not always available.
We also explained why the profit is almost doubled with pairs rather than single direction ETFs but most significant is their ability to substantially increase profits while simultaneously reducing medium- and long-term risk.
We did also point out that you need a good direction finder to select which half of the pair you should be invested in. This is now easily done by subscribing to our daily signals.
From all the trades published each month on the History Data page of our website, our average winning and completed trades generally runs between 60% and 72% winners.
Elections Affect Profits. - - - - - This chart shows profits by entry date from March 5 through the 2018 election for IM Pairs and MIX Pairs.
All About Inverse Leveraged 3x Pairs.
Sometimes the group that rises to the top is not for you. I need to always explain for newcomers, the differences between some of our groups and categories.
First, it is important to review the two IM groups which begins at the bottom of Chart 1x with the group - IM Bull 3x - ranked at #7 and finishes with the group -IM Pairs 3x - ranked at #4.
An early investment theory that I learned was all about RISK. With that in mind, a very important fact is the Pairs group, making 69% annual return, is much less risky then the Bull group making only 36% annual return.
The short explanation for this involves the new ways that we can now trade using inversely correlated pairs of ETFs.
On November 5 we wrote that the average number of days that we are in any trade is less than 10 days. This is important because there is a significant management cost in re-balancing leveraged ETFs every day and a we want to avoid long-term ownership.
Our algorithms specifically maintain short-term investments because they are designed to look just one day ahead and are then re-calculated every day ready for the next day.
The pairs that we select are all close to 100% inversely correlated; in other words, they move in almost perfectly opposite directions.
This means that when investing in these inverse pair selections, we make a profit, no matter whether the underlying asset is going up in value or going down in value. Consequently, we are only out of the market during the few days that we cannot determine which direction to own.
So, if you follow our algorithms and agree that they do have the ability to profit on a surprisingly steady basis, then you must agree that we make a profit on the way up, and we make a profit on the way down.
This explanation shows you why the better performing Inverse pairs are usually making almost twice as much profit as the lower performing bullish-only single direction ETFs.
As an example, if the pair of ETFs are based on the stock index � S&P 500, we make profits when stocks go UP in value, by buying the ETF � SPXL.
Equally true, we make profits when stocks go DOWN in value, by buying the ETF � SPXS.
All you need is our algorithms to tell you in which direction stocks are likely go tomorrow. That is why the RISK is lower and the PROFIT is higher. You can now buy both directions without old fashioned short-selling.
Have You Noticed?
I am really looking forward to seeing the investment climate returning to more normal cycles after these elections.
During my monthly research with investment professionals this month, they also note seeing unusual movement and volatility in recent months.
It must be no surprise that large investor portfolios also use algorithmic trading techniques and anything that breaks up the harmonics of their data points to a different cadence, causes unexpected returns.
I am watching an anomaly that we have.
We keep a record on a chart we call � UP and it currently shows that for the Best 5 Pairs group, the overall average gain on the first signal day, UP moves are 2.4%. The overall average first signal day loss is 1.9%, so we do have a net profitable decision day that currently provides a 0.5% profit.
The point of my comment is that the percentages are measured at the close of trading on each first day. If you were to watch every trade, you would notice that they often start that first day with a loss.
That seems like the decision may be wrong and could be improved but the fact that it starts with a loss is helping to provide the end of day gain.
The only way to be more accurate with the signals of less than a day would be to watch the markets all day long and perhaps use an hourly decision with similar algorithms.
Well, the big guys are doing that every minute or every second, but their computers place more large orders much faster and at much lower commissions than we must trade with.
So, what is my point. Those big guys have a lot of money to play with, but they make smaller annual returns than we do.
Perhaps we have the best of all worlds!
What Happens After Elections.
RiskHedge Report has published their findings for investing after these midterm elections and they don�t see any bad news to worry about.
First, they report a 28% rise in the stock market since the last general election and second, they say there is an 85% chance that Democrats will take over the House of Representatives.
Their investment message is this: - since the end of World War II, there have been 18 midterm elections and no matter what the political outcome was, US Stocks have always climbed higher in the following twelve months.
Back on October 11, we sent out a chart of the market corrections which included a similar survey from 1962 by Strategas Research. On October 17, we sent out the Partisan Conflict Index from the Federal Reserve Bank of Philadelphia. Both were a result of the variations in volatility that we were finding in the markets.
We have since heard comments from various investment managers and of special interest was their algorithmic trading was not performing well due to these conditions and they had lost some profits.
We expect 2 years of relative normalcy from now on and we will keep watch for changes. Our algorithms are very short-term oriented and quickly get out of conditions they don�t like.
The difficulty is the churning that takes place based on unnatural volatility and the result can be little forward progress.
Mathematical algorithms get their strength from thousands of calculated built-in norms and historical facts. Radical changes from past norms are their enemy.
There is a positive side to new short-term experiences, and we have made very small but positive adjustments that will be more helpful if these conditions return, (perhaps in 2 years).
Average 82% Annual Profit in 245 Days.
Our latest, highest current annual profit is 154% and our low-risk conservative group produced 34% in just 245 days.
All trades from Chart 1x are conveniently sent to followers on the previous day. Where else are these returns available in a choice of investments and a free Blog?
(blog continues below chart.)
Our unique mathematical algorithms have been developed over 8 years and here is how they were developed.
Primarily designed to mimic portfolios of professional Investment Managers, they have proven ability to enhance leveraged ETFs as well as inverse ETFs and Stocks.
It started over 10 years ago when I became the Administrator and had responsibility for managing the operations and investments for a USA government ESOP program, also known as an Employee Stock Ownership Plan.
I had related experience but not enough of it. I consequently spent many hours studying large investment portfolios in the USA and Europe and first developed a method of using percentiles of assets, based on changing economic opinions and economic conditions.
This idea first served as a model for a portfolio of Exchange Traded Funds that could equal this new investment model and it avoided the need to individually select stocks and/or Mutual Funds. This then led to a series of formulas and algorithms that could adjust the selections in the model.
At that point, with my background in engineering, I started looking for ways to buy and sell at appropriate times, depending on various variable data that I could collect and develop.
I enjoyed doing this, and at that same time the Exchange Traded Funds market was rapidly expanding. Portfolio Managers that I studied, were moving toward ETFs and away from Mutual Funds mostly for the efficiency and the savings that could often be a half-percent or more each year. These ETFs also offered variations in vertical sectors as well as the standard Indexes.
ETFs have quickly revolutionized the investment industry and inverse as well as highly correlated ETFs now offer increasing possibilities for these managers.
My algorithmic models broadened into shorter term decision-making deciding when to own or avoid ownership of the various ETFs. I also found they worked in combination and are efficient and accurate enough to work with leveraged as well as inversely correlated pairs of ETFs.
Important Note: - Investing in better than 95% inversely correlated and leveraged ETF pairs with proven algorithmic decisions, provides a lower-risk strategy that invests in both directions of covered markets. Leveraged pairs requires a short-term investing decision process and our investments from our algorithms typically average less than 10 days per trade. Our lowest-risk Investment Manager group produced 71% annual return.
Fortunately, my team of managers and geeks are still working with me, and that is mostly why we exist and why 48 years of various business enterprises continues to work for a broad range of our Customers.
Back-Testing Things to Know.
We like to show our back-test history for everything that we recommend, and I suggest that you look at the Other Boosters page and then click on the last Volatility Pairs chart. Now follow a few points that will help you to understand how our algorithms work.
First you see the chart with 2 inverse pairs listed and below them you also see the CBOE Volatility Index. I will explain that later but first scroll down the Other Boosters page to see the first chart SVXY of the first pair.
Notice the sudden drop-off in February for SVXY and the relative continuation of our Booster algorithm.
The SVXY drop-off occurred when Credit Suisse removed XIV, a favorite ETF, from the market and SVXY suffered the same punishment but was retained at far lower prices. The underlying problem was that both ETFs moved inversely to the VIX Index and were caught in a huge spike in volatility even though general stocks did not suffer in the same way. You can see the spike if you scroll down to the bottom chart of the VIX Index.
I am using the SVXY chart to demonstrate how our algorithms take advantage of up moves and get out of down moves. However, it also serves to demonstrate that volatility is unique and requires some knowledge and a risk level that has surprised investors in the past.
The pair to SVXY is UVXY which moves in parallel with the VIX Index and makes up our first pair.
The next chart for UVXY shows again how our algorithms seek to take profits even when a meandering ETF is generally going nowhere.
Our second volatility pair is VXX which also moves in parallel to the VIX Index and ZIV which moves inversely to the VIX.
This volatility pair also shows the action of our algorithms relative to each other and their ability to take profits and avoid losses from both.
Volatility has become a major tool for large investors as a hedge as well as a profit center and can be directly owned through the Futures Market and Options on those futures. With the advent of ETFs and ETNs, it is a popular, if different type of investment.
Finally, we run the VIX Index itself through our algorithms, giving Buy and Sell signals but do not specify any derivative investment at this time. It is useful to investors who may invest in VIX Index related products.
Finally, we like to start all back-tests with $10,000 because it simplifies calculations and helps to make comparisons with everything that we do. We also start the graphs at zero percent instead of their price in dollars to easily visualize the gains and losses relative to 1 year ago.
Comments on Change.
There will be more improvements and changes on Monday than we have had in quite some time.
In my monthly checkups with Investment Manager portfolios, I also heard a revised sense of what they are expecting and there is a more widespread sense that interest rates may be slower to rise than previously thought.
I also hear that growth will be slower than 2018 but the tax cuts should provide positive markets well into next year.
Meanwhile, Monday Buy and Sell signals will be available as usual on Sunday.
For us, November Starts next Monday.
I meant to mention this yesterday, but we need to start each month on a weekend due to the necessary changes and to add History Data and new charts for the individual ETFs.
The Best 5 Stocks will include some changes as well as the Best 5 Pairs. We have adjusted our methods of choosing what to include in these groups and we hope to see improvements in both.
You will not see any changes in the Volatility Pairs although we have some interesting mods in the algorithms and we expect the signals to be better timed.
I am sure you have noticed that the Best 5 Stocks are usually good performers on their own merits and our algorithms do not make so much difference when the underlying asset moves well. However, they may be subject to more powerful reversals and the algorithms help to get out quickly when that occurs.
Recall that we recently had a stock with sudden legal problems, which was not helpful, but we also had a buyout offer on another stock that gave us a one-day boost and then nothing for the rest of the month.
Regarding algorithm performance, the elimination of annual losses is very noticeable if you check out the individual back test charts on each group page.
The change in the Best 5 Pairs is small but may be significant. The new selection will include pairs that meet all our volume and performance requirements, but we added a need for better performance on the downside with the expectation of improved overall performance.
Volatility Pairs are a different story. We started some years ago with volatility and were greatly disappointed when Credit Suisse took XIV off the market. We have entered that market again with our concentration on safety and limited risk using inverse pairs.
Volatility moves to a different drummer and we have adapted our short-term inversely correlated pairs algorithms to take advantage of the volatility market. Long term followers will know our saying that � Volatility always eventually returns to the annual average value.
Traders in volatility know that the VIX Volatility Index never goes down to zero and never goes up and stays there. Just like a yo-yo, � it goes up and down and continuously crosses the annual average value.
Our 2 Volatility Pairs have performed well and should do well in our ranking Chart 1x in the future.
Over 1,000 Trades in 240 Days.
We are always looking for new ways to assess our progress and improve results where we can find opportunities.
These totals include duplicates as some ETFs are being used in different groups.
The current set of charts date back a total of 240 days to March 5, 2018 and include a total of 1,005 round trades since then.
There were 601 profitable trades making a total profit of $15,957 or $26.55 each trade and 404 losing $8,242 or $20.40.
That translates to a winning percentage of 60% wins and 40% losses for the entire period since March.
Some followers will recognize that this ratio has gone down from 70% winners in recent times and I must point out once again, how difficult this election period has been for traders and not just for our algorithms.
Fortunately, we have been doing this for a few years and markets do not always behave in this way. Of course, surprises will always move markets up or down, but they will not always reflect political dialog and hateful rhetoric.
Our emphasis from day 1 was to produce a method of zeroing in on tomorrow and how we could find sources of data that will help make these decisions. My confidence stems from how well this has worked during the 3 years that we have pre-published our trades.
I started the blog today with a few numbers and a few complaints about the current climate, but we have gained knowledge from this current exercise and have already made some adjustments to our selection process and to our algorithms.
You have already seen the obvious superior results being obtained from our pairs trading groups as opposed to the straight bullish groups and some additional tweaks will be applied in November.
Not to stop there, these small but significant changes will be added to our volatility pairs in November also.
A Good Time to Review Results.
Now is a good time to look at our results, especially close to the end of this political period of small gains and great volatility.
If you are trading any of the ETF groups, this political season has frustrated your profits especially if you started recently.
This is a great reason why we concentrate our algorithms more and more on trading inversely correlated ETF Pairs that perform great in most markets.
The bullish single direction groups have given some early profits back and are currently disappointing but will improve.
So, we need to look at what is going on, and a good place to do this is chart 1x which is available every night on the Blog or website.
First, if you are using Interactive Brokers.com which we also recommend, your brokerage fees are about 1/3 rd. of those listed on the charts from Tradier. Although we also use Interactive, we started all the listed groups with Tradier and will stick with them for now.
Tradier does offer $200 or 60 days of free trading for new accounts if you use the code ROEBUCK200.
Brokerage fees affect everyone, but it should also be noted that the professional accounts that we correlate the IM groups with, generally are charging 1% to 2% per year to their clients, depending on funds and fees. Also, the size of your trades makes a big difference. We have standardized our trades at $2,000 per ETF to have all the comparisons that we need to publish.
So, it is the single direction bullish groups in this political climate that have mostly been a recent challenge.
Recall that the IM Bull 3x group is 95% correlated with these professional investment portfolios and they include US, EAFE, and Emerging Stocks plus Fixed Income bonds. At 25% current return and 38% annual gross return, it is doing more than twice the profit of professional world-wide portfolios that you compare it to.
All our charts use $3.49 Tradier commissions whereas Interactive Broker commissions are about $1.00 per trade. The net current commissions on the above IM account would be less than 6% and the annual profit would be about 32%.
The combination of our 1-day short-term algorithms and 3x leveraged ETFs are providing great results but this political season of day by day reversals and high volatility is not the climate that works best for anyone.
All groups of pairs have worked their way to the top of the current ranking list on chart 1x and long-term we expect them to stay there. The two Bull 3x groups remain at the bottom of the ranking and the bullish Best 5 group has also fallen from the #1 position.
We will soon be out of this election period and back to the markets we were experiencing before mid-September. Short periods of reduced performance and shocks associated with overnight news items will always be present. However, overall performance remains excellent.
A Day of Great Sadness.
As an immigrant myself, I need to participate in a day of sadness and remembrance today.
My early days were spent in and out of an air raid shelter and I intend to join in the days for a revival of the unique American journey that brought me here.
Normal service to Customers will remain and the Blog will be back tomorrow.
November Anticipation.
8 years ago, we were making changes all the time but now we offer services to Customers, we must treat changes more carefully.
You know that my motto has always been � There is always a better way.
And so, we have several changes that we have been testing that are increasing the profitability of our algorithms. How long should we test and how long should we wait before publishing them?
We normally make changes at the start of each month and we will begin by making some of these adjustments in November.
One change that we consistently make is the selection of stocks in our list. Recently, we have reduced our list down to only 5 stocks mostly because of the increased safety in trading inversely correlated pairs.
Much of the time, our two best performing groups have been Best 5 Stocks and Best 5 Pairs 3x.
We are changing the method we use to select the best stocks and are confident that we will see long term improvement. In any of these changes we can quickly go back to previous methods if we see that need.
The second change we are making in November involves the selection of the Best 5 Pairs group.
One of the difficulties that we all face is the investment climate that we find around us. Many articles and suggestions, some that we have referred to, indicate how the current political mid-term elections may affect conditions going forward. We have certainly suffered some of that effect since early in September and we are aware that a different climate may be present after the elections.
Some interesting results show that the two sets of Bull 3x groups have not performed as well as the Pairs 3x groups. You can see where inversely correlated pairs are high on our list for less risk due to trading both directions.
Another interesting note that we will be discussing soon is the way the Volatility Pairs group has crept up in the 1x ranking chart.
As always, if you see a change in the assets for the group that you are following, we recommend 2 simultaneous trades to sell the old and buy the new.
Trade at Open Tomorrow or Close Today.
Is it a bad idea, a poor decision or just plain wrong to wait until tomorrow morning to make our trades?
I finally had a question about this and realized that we should explain why we do it as it did seem like a problem when we first started.
You might have slightly different results than we do because the value of your shares might affect your result. We have eliminated the broker commissions as it makes no difference to this calculation.
Over thousands of trades we calculated the difference in value between the closing price today and the opening price tomorrow is $0.16 of additional cost to us. This probably reflects the upward trend of the markets.
However, as we make the same number of buys and sales on the following day opening price, it costs $0.16 cents per share to buy but we make a profit of $0.16 cents per share on every sale.
So, the benefit of having all evening to decide and make the trades ultimately makes little difference to our trading methods but does add a great deal of convenience.
Algorithms Search for Similarities.
Unfortunately, we all woke up today to find another news item that will most likely hurt us all. These overnight shocks to the system have results, whether partial or intended, and algorithms that we create do not like them.
I can only say that in the long run, the blips will mostly be buried, but few systems that are looking for multiple repetitious indicators can be prepared for random social or political events.
We will continue to let our algorithms recalculate every day but also repeat that personally, I look forward to the days after the mid-term elections.
We are both excited at our progress but disappointed at this event and this election news cycle. Having left the UK in 1963, my first comments on overnight news events was the BREXIT vote surprise when the UK voted to pull out of the European Community.
As a consumer of all things Winston Churchill, who first spoke of the need for European countries to organize, I was disappointed by that news. However, it cannot go unsaid that the women in my family voted against BREXIT, showing once again, their wisdom.
When dealing with leveraged ETFs, it is like trading options in that losses can appear quicker than profits. I learned the lesson then that selling was always an available strategy.
Enough negativity. As of yesterday, we do have some great results ranging from our IM Bull group at 42% to our Best 5 group at 160% annual returns and we see some investment climate and algorithmic improvements coming very soon.
One of these changes will be our Best 5 Pairs 3x group which has currently produced 102% and 144% annual return.
Also interesting is the Volatility Pairs are performing better now.
Professionals are Holding On.
A brief look at those originating professional investment manager portfolios shows little change today.
1%-2% cash and 14%-15% fixed income is still the norm even as interest rates have edged higher. A rumor today was that the next interest rate hike may be later than expected.
65% of mixed US stocks along with 16% of EAFE stocks (Europe, Australia and Far East), topped off with 3%-4% Emerging Markets.
Barely one or two percent shifts from recent monthly totals.
Our Ratios, Ups and Win charts have lost some wins and are down from the 70% range to 61% today. Ratios are also cut in half from about 4 down to 2.
Personally, I am looking forward to November 7 when we hope to get back to a more normal trading climate.
Oil was down over 4% today and there is no shortage of fear as the VIX Volatility Index was over 24 again before closing around 21.
Politics Can Be a Good Investment.
Oppenheimer & Co and Bloomberg put together this chart showing the average returns for each quarter of the 4-year election cycle since 1929 and it looks like pretty good sailing after these elections.
The 3rd. quarter this year saw the S&P 500 closing at $2,914 and the average return for the 4th. quarter of 6.7% would take us to $3,109 by the end of 2018.
If we are to believe these averages, we will see a 12% gain from today for the balance of this year.
Who amongst us would not like to participate in this potential party.
So, for the sake of going to the party, I look at our Chart 1x for today and see that since March 5, 2018 the S&P 500 has gained 2.8%.
For the same period, Roebuck Systems average return for all 7 current groups was 61%. Now if we divide 61% by the 2.8% S&P gain, we get a multiple of 21 and continuing the party atmosphere, the 12% gain of the S&P 500 multiplied by our multiple will put our return from today at about 252% by December 31, 2018.
If we assume that this number is an anomaly, we can look at the end of the third quarter just to check it out. Sure enough, the third quarter from Chart 1x on Sep 30, the S&P 500 was up 8.7% and Roebuck Systems average was up 79%, giving us a multiple of 9.
Just as a further check, from Chart 1x after the second quarter, on Jun 29, 2018 the S&P was up 1.4% and our average was up 37%, giving us another different multiple of 26.
Obviously, these second and third quarter numbers cover a wide range. If I average all results together, I get a new multiple of 21+9+26 = 54/3 = 18, and if I multiply the expected 12% S&P 500 gain by 18, our profit from today will be 216%.
Finally, we can calculate all 3 individual results to see the range.
21 x 12% will give us 252% profit.
9 x 12% will give us 108% profit.
26 x 12% will give us 312% profit.
Returning to Chart 1x for today, our annual return for all 7 Roebuck Systems groups since March 5, 2018 is 96% and this in the middle of these difficult Mid-Term elections. My goal for December 31, 2018 is somewhere between our current return of 96% and the high potential of 312% so I will be at the party.
Updates and Changes.
We keep looking for improvements to our algorithms and recently you may have seen my comments on the changing market climate regarding politics and the government Partisan Conflict Index.
Elections may be the leader in market climate seasonality but not enough for us to make significant direct changes to the algorithms today.
We have always based our models on changes to tomorrow and then repeating that process every day whereas other models are often based on weeks or months and even annual cycles.
We did show recently where the average downward correction during the last 56 years for mid-term election years was 19% but the average upward move for each of the following 12 months was an average of 31%.
My point is that zigzag prices on a daily schedule are not helpful to algorithms that only look short-term at tomorrow and of course, that refers to us. The other side of that coin though is our unique ability to stay with and multiply profits from trends and take advantage of that 31% gain statistic.
I am not a politician, but I have heard it said many times that the best times are those with mixed governments and mixed economies.
Regarding the changes that I started to discuss, I do anticipate some differences in the algorithms in the next month or two. We did accumulate an enormous amount of data over these past 8 years and some positive adjustments will be made.
IM Groups versus MIX Groups.
We generate a monthly updated portfolio of professionally managed assets that are currently held by large world-wide Investment Managers.
We then build a matching portfolio with a set of 10 ETFs, (Exchange Traded Funds) that are approximately 95% correlated with the Investment Manager Portfolios.
Our initial group consists of 10 bullish 3x leveraged ETFs that reflect the same mixture of assets and fixed income investments which we adjust each month. We call this our IM Bull 3x group.
The above group is made up from ETFs that have Inversely Correlated ETFs that trade in the opposite direction.
Each of these pairs make up our second group and consists of 10 pairs of 3x leveraged ETFs that also reflect the professional investment managers.
We call this our IM Pairs 3x group.
It is important to note that our algorithms base their daily Buy and Sell signals, by projecting direction for the next trading day only and are then recalculated after each day.
By using these signals for the IM Bull 3x group, they tend to stay with profitable moves and get out of the position when changes are projected.
Signals for the IM Pairs 3x group, when changes are projected, they will signal a Buy for the inverse version of that ETF pair and will then tend to stay in the new position until a reversal is projected.
Our next two groups operate in the same way as the first two groups except they do not reflect any managed portfolios. They are chosen from different industries and sectors that make up a high performing and high-volume group of ETFs with few monthly changes.
The first of these two groups consist of a mixture of 10 bullish 3x leveraged ETFs and we call this our Mix 10 Bull 3x group.
Similarly, the second member of this group is made up from the same ETFs along with their Inversely Correlated ETFs which we call our Mix 10 Pairs 3x group.
Our next group is a selection of bullish performing stocks/ETFs that have a recent history of high performance which we call the Best 5 Stocks/ETFs. This group can change the most at the beginning of each month.
From all our pairs selections, we make up a list of 5 inverse pairs that are currently performing well and create the Best 5 Inverse Correlated ETF Pairs.
Finally, we have two pairs of inversely correlated ETFs that are derivatives of the VIX Volatility Index called Volatility Pairs.
We also include the VIX Index itself, although it is not available for trading except through the various derivative assets.
Fed Partisan Conflict Index.
The Federal Reserve Bank of Philadelphia tells the story of our political volatility since 1982 with their Partisan Conflict Index as shown below.
It displays the recession that started in 2008 and the doubling in partisan conflict for the next 8 years but it also shows still greater conflict during the past 2 years.
(blog continues below charts)
Here are some of their comments from their website which specifically apply to the source and the effect of elections: �
The Partisan Conflict Index tracks the degree of political disagreement among U.S. politicians at the federal level by measuring the frequency of newspaper articles reporting disagreement in a given month. Higher index values indicate greater conflict among political parties, Congress, and the President.
The index is an outgrowth of recent Federal Reserve Bank of Philadelphia research that finds that the index tends to increase near elections and during debates over such contentious policies as the debt ceiling and health-care reform. Research suggests that increased partisan conflict increases uncertainty among firms and households. Such uncertainty has been shown to slow economic activity by delaying business investment and consumer spending.
My comments are more to do with the near 55% drop from March 2017 when the index topped out at 271 down to the latest reading for September 2018 of a much lower 127.
Looking at this as a built-in volatility index, this last period would tend to work against smooth trends and give more support to those short-term reversals that are difficult to define.
Overall, there is support for upward trending markets after the elections.
Markets Regain a Third of Their Dip.
It is good to see prices regain some of their recent losses but there is little happiness in the news today.
We were well positioned in the Best 5 Stocks but caught in a few switches in some of the Pairs groups.
Looking one day ahead as we do, will usually end up in choppy conditions when trading with inverse pairs and we much prefer seeing markets go in the same direction at least for a few days.
Three days ago, the VIX Volatility Index was near 29 and ended today down below 18.
Mid-Term Election Corrections.
Received this chart over the weekend provided by Strategas Research Partners and found it to be a very interesting historical look at our upcoming elections.
As measured by the S&P 500 this year, we closed out 2017 at 2,673.61 and the low point this year so far is 2,532.69. That is a 5.27% maximum decline so far for this year.
This year appears to be the smallest decline in any mid-term election year since 1962. The previous low was down 7% in 2014 during President Obama final 4-year term.
Not very surprising is the worst mid-term election year was 1974 when President Nixon resigned. In that year the markets were down 38%.
The average market correction for the previous 56 years of mid-term elections was down 19% as seen on the attached chart.
Now comes the good news. One year later after every election, the markets were up by an average of 31%. The smallest gain was up 9% and the largest gain was up 58%.
Always looking for numbers that might possibly tell us where the future lies, I noticed that in 1974 when the market low point was down 38%, one year later in 1975 it was also up 38%.
In 2014, when the low point was down 7%, one year later it was up 9% so there does appear to be some possible correlation between these numbers.
If so, and if you like to gamble, the markets in November 2019 might be up in the range of 5% to 7%. A cautionary note would be that this year is not finished yet and we may need to recalculate.
We did also have 2 other significant short-term corrections within this year. The January-February correction was 11.84% and this recent October correction was 8.43%.
Most Indexes Back to 200 Day MA.
This is true except for the Russell 2000 and Emerging Markets, which indicates that the larger equities have put the brakes on to test the winds on Monday.
While looking at charts and those moving averages, and considering past habits (before algorithms), I was looking at our Best 5 Pairs for this month.
(blog continues below charts)
I found it interesting that we will own all the bullish sides of these pairs at moving average levels after trades on Monday morning. I mention this fact because those moving averages are not directly within or a part of our algorithms.
I liked seeing this because it shows a relationship between all the technical indicators that we watch over the years and our algorithms.
This week demonstrates the nature of algorithmic trading. We need to shed some positions on the way down so that we can buy back into those positions on their way up. It also demonstrates where that extra profit comes from when using inverse pairs trading.
You get to make that extra profit from those positions that have reversed quickly and were within the harmonics of their algorithms.
Nobody wants a recession or market reversal of any size, but it creates the insurance policy that comes from pairs trading. It is likely that you could ride the down move for much of the way down.
Pairs Traders Can Deal with Reversals.
That does not mean we like reversals, but it does help alleviate the worry in the longer run.
The problem with algorithms is you still remember all the years of intense decision making that brought you to the point of liking them.
Inverse pairs trading puts the icing on the cake, but few people enjoy these days, especially if you still watch the markets and political news all day long. They continued with their slide today even though interest rates are still low, the economy is high and tax cuts are still feeding the frenzy for a while longer.
The markets have all overshot the 200 day moving averages on the downside. We are certainly living in a new world today and probably must learn new rules of investment.
Inverse pairs trading allows for changing times and changing directions, especially with a set of algorithms that have a history behind them. Admittedly, we traded up to the higher risks of leveraged ETFs instead of their un-leveraged equals. We did this because we accept the higher volatility and the rolling losses incurred by the producers of the leverage.
However, these turn out to be positives, especially when looking at the smoothness of the daily graphs of pairs groups versus their bullish-side only group.
Zigzag prices on a daily schedule are not helpful to algorithms that only look short-term at tomorrow but if prices did start moving in a zigzag pattern, our algorithms would soon catch up with it.
Volatility - Late comment on signals.
Volatility Pairs are showing large advances from the close and should only be bought close to their Wednesday market closing prices.
A Chaos Day for the Markets.
A large number of trades today and many of them signaling a switch in direction although several pairs were in a neutral position.
The Dow was down a huge 832 points or 3.15% and the S&P 500 was down 95 points or about the same at 3.29%.
The volumes today were extreme compared to recent days and the news all day was more and more concern about Hurricane Michael and all the damage. These actions over the longer-term favor pairs trading due to some of the trades being in opposite directions.
As we run the algorithms every day to get these quick decisions, the worst situations are those that reverse just as quickly as they occurred today. Fortunately, that is unusual and would not be helpful to us.
The pairs trading in larger groups usually comes out best of all because we are likely to be in opposite directions in some of the pairs and if the trends continue for more than a few days, we can profit from them.
Minimum Test or Minimum Investment.
A good way to test our algorithms and at the same time, test our Inverse Pairs trading would be to select from our Best 5 Pairs 3x group.
Many times, a quantity of 3 is mentioned as a minimum number for any test. That would be good for testing a program, but I recommend 5 when testing is complete and serious investing begins.
For first timers trying inverse pairs, a single pair from any of the groups with $500 or more would work but I recommend reading the Blog on Saturday Oct 6 2018 for more information on this subject.
Of course, any of the Best 5 Stocks would also work as well as any of the ETFs but the bullish side of the ETF pairs is usually more profitable than the bearish side.
Worth repeating here � When our algorithms signal to buy the second side of any pair of ETFs, you can decide to buy it or decide to sell the side you already own. Both actions will place you in a neutral or close to neutral position as all these ETF pairs are inversely correlated.
Testing small groups with our algorithms works well because they quickly get out of any investment and in the case of inverse pairs, they also get into the opposite direction very quickly.
It is no surprise that as we sort out all US stocks and all ETFs that make up our seven groups, the small groups of 5 pairs or 5 stocks tend to hold the highest ranks for profitability. The larger groups of 10 bullish ETFs and 10 inverse ETF pairs rank lower.
The 2 volatility pairs that we offer belong to a unique sector of investments along with the VIX Volatility Index and are often used separately for hedging with Futures and Options derivatives.
Wikipedia on Black Boxes!
After receiving a comment, I checked with Wikipedia and read the following: -
Almost anything might be referred to as a Black Box: a transistor, an algorithm, or the human brain.
Regarding the algorithms, we have developed mathematical algorithms that we call Boosters and we certainly have heard about them in Black Box investment programs.
It has been a continuation of a career in engineering as well as a second part-time job trying to be an investor.
Transistors are also familiar as I had an early experience with them.
Many of us had crystal sets when we were young kids, and I remember wiggling the steel spring against the crystal to find a radio station. I found Radio Luxembourg with enough volume, but it was often drowned out by Mr. Tuck from 4 doors up the street, whose hobby was broadcasting on his short-wave radio.
At some point, I acquired a transistor that would replace the crystal and suddenly I had my first transistor radio.
Our Black Box is a series of mathematical formulas (with a few transistors) that mimic the human brain just as Wikipedia says and it sends out signals to Buy or Sell.
This Black Box currently produces a 3.4 ratio of profit to loss from all trades and a 2.4% first day only profit from all Buy signals. It also produces a 65% combined winning trade percent from the entire selection of ETFs and Stocks in all our groups.
First, Decide Which Group You Like!
We like charts and we have another for you to look at. Profit is the chart name and it may help you to define which type of investing you like to do. There are 4 main groups that we currently employ and specialize in with our algorithms.
First are the two IM Investment Manager groups that correlate better than 92% with professional manager accounts including fixed income. If you trade all 10 bullish ETFs or 10 ETF pairs, you match their account selections as well as being in 3x leveraged ETFs.
However, unlike their accounts, you will trade in and out of each position by using our algorithms to increase profits.
Looking at the Profit chart, IM Bull 3x made $7,476 and IM Pairs 3x made $12,298 in the 7 months since March 5. On average, they made $5.91 and $6.53 for every day that each ETF was invested during those 7 months.
The chart lists the total number of days that all ETFs were owned during this 214-day period. Example, 1265/214 days = average of 6 bullish ETFs held every day or 1885/214 days = 9 sides of the 10 ETF pairs held every day.
Comment on pairs trading � When our algorithms signal to buy the second side of any pair of ETFs, you can decide to buy it or decide to sell the side you already own. Both actions will place you in a neutral or close to neutral position as all these ETF pairs are inversely correlated.
Second are the two Mixed 10 groups of ETFs that are also 3x leveraged but are not correlated to any investment program. However, they are almost 100% inversely correlated pairs in a variety of sectors. You can select all 10 of these pairs or choose just those that you prefer.
Looking again at the chart, Mix 10 Bull 3x made $10,309 and Mix 10 Pairs 3x made $15,703 in the same period since March. On average, they made $7.79 or $7.76 for every day that every ETF was invested during the 7 months.
Next, we have two Best 5 groups. The Best 5 Stocks group sometimes changes each month and includes 5 current selections that have good potential performance with our algorithms. The Best 5 Pairs 3x group can also change each month and includes our selection of the best performing inverse pairs from the above 20 pairs.
Once again from the chart, Best 5 Stocks made $13,200 and Best 5 Pairs 3x made $11,534 in this period. On average, they made $14.95 or $12.26 for every day that each was individually invested.
Finally, our two current inverse Volatility Pairs represent our move back into volatility trading. As they are based on the VIX Volatility Index, they have unique patterns of profit and loss and currently made $1,632 during the period and $4.49 per day per ETF when invested. We also run the VIX Index through our algorithms as an added feature for those subscribers that use it and find it helpful.
We run all 50 algorithms every day and send out our Blog plus charts to all followers every evening and include signals to all subscribers. I hope this explanation of this chart helps you to follow our available programs.
The Geopolitical Risk Index.
The political affects on the stock markets since the 9/11 attack have never been able to get back to the latter half of the 1990s as measured by the Geopolitical Risk Index.
The low point was 2012 and it has been rising ever since with a couple of peaks in 2014 for the Russia-Ukraine crisis and in 2015 for the Brexit vote in the UK.
Unfortunately, the 12-month average is still going up and the volatility is also rising. This makes it more difficult to follow trends and requires another degree of expertise in politics.
The two crises above happened very quickly or overnight with regards to the Brexit vote, but both had lasting effects.
The continuing increase and volatility appear to be a result of extreme partisanship and identities that we are now experiencing but it is probably going to take just as long to go away as it has taken to occur in the first place.
We cannot claim forward knowledge of this news cycle 8 years ago, when we started with our algorithms, but we can claim their benefit as we look at them today.
The two ideas we had initially, were to use professional asset selection and second, to concentrate on which direction will these assets move tomorrow and then to re-check the direction every day.
By checking the individual back-testing of the current selections on the group pages, you can see how quickly they tend to get out of trend reversals and how long they will also wait to get back in.
Tempted to Read the Tea Leaves.
Occasionally you get a day like today and you want to slip into old habits.
From our Investment Manager selections, Gold Miners and Bonds are both changing directions according to our algorithms.
They are going bullish on the gold miners and bearish on bonds tomorrow and there are different ways of interpreting those facts according to what you follow.
I look at the algorithms and do as I am told but I did sneak a peek at the charts and gold miners are in a longer term down trend but recently up against their 50-day moving average.
On the other hand, bonds have recently had a strong move up and away from their 50-day moving average as well as away from their 200-day moving average.
So, it looks like gold miners are in a longer-term down trend, but we are looking for a short-term reaction. With bonds, they have strayed too far away from the averages and our algorithms are seeing an opportunity for a shorter-term bounce back to their averages.
Call me lazy, but I can take all night deciding what the meaning is behind all these technical details (which often disagree with each other), or I can do what I am told to do by the algorithms in about 10 minutes.
We mathematically look back as far as the data seems useful and attach ourselves to current trends but get out quickly if we are wrong.
Come to think about it, that seems very similar to when I used to take all night to make the same decision.
Chart 1TPC on Current Selections.
Occasionally we show this chart and perhaps we should do it more often.
It primarily was meant to measure the performance of our algorithms compared to the S&P 500 and as shown we have 5 ETFs performing worse and 45 performing better. Only 1 of them is minus and that is DRIP which pairs with GUSH, the best performing of all.
In fact, GUSH appears twice this month because it also appears as one of our Best 5 group.
All the better performers are in the top ten along with a sprinkling of 5 ETFs.
We do make some progress each month as we make the selections for the various groups. I am probably not going to mix ETFs into the Best 5 group in future months as it does create these duplicates and I think we are better off with our original concept of separation.
Had a great question again today about our original Investment Manager group and am putting my answer here as it may help others.
- - - -I am curious if you have algorithm for etf's only, but without the leverage (2x or 3x) or inverse etf's.
Great question - when I started I had decided to analyze what the best and biggest accounts around the world were doing so that I would not have to choose the stocks or funds.
I then matched the portfolio with ETFs that correlated my research because they are moving to ETFs as well. I found that my algorithms improved the return by 200% to 300% and because I concentrate on very short-term projections, we quickly got out of assets that reversed direction.
Next, I matched the portfolio with leveraged ETFs because I was able to get out so quickly. The net result is that nobody wants to know about the non-leveraged groups when the same concept works so well with the leveraged version. Further than that, by using the inverse pairs concept the results are even better.
I should have added that now we have the IM Bull 3x group which uses the bullish side of the IM Pairs 3x group. Both perform well and much better than the non-leveraged groups.
For a long-term larger account, I have to recommend the IM (Investment Manager) Pairs but they are all based on the same algorithms. Thanks for your question. Malcolm
Why Include the VIX Volatility Index.
The S&P 500 is widely followed as the benchmark of large cap US stocks and represents about 80% of available capitalization.
The VIX Volatility Index is a measure of the expected future market volatility of the S&P 500 Index as measured by options on the S&P 500 Index.
Bloomberg published about 12 years of the relationships, (2000 through 2012) between the S&P 500 and the VIX Index showing an inverse relationship for about 80% of trading days. So, why include the VIX Index if it cannot be traded?
Like most assets these days, ETFs are available to traders for the VIX Index.
Bloomberg results for 12 years tells us that if stocks are trending up, volatility is trending down and vice-versa.
Unlike gambling on red or black, if you have knowledge of the future direction of this Index, you have an 80% to 20% advantage of knowing the direction of them both.
If you consistently watch the news and the Feds increase interest rates by 1/2%, that could depress markets and increase the odds of volatility going up.
On the other hand, if the news tells you that unemployment has an unexpected drop, your fear of the future is reduced, and markets may go up with volatility going down.
This explains why the VIX Index is also known as the FEAR INDEX.
This is a day-traders signal and with your finger on the buy or sell button, you could make gains until the news tells you to reverse your trade.
We have added the VIX Volatility Index because traders who feel comfortable with highly leveraged ETFs may also find the VIX to be a useful additional tool.
Volatility is a unique Index and we do not have a series of similar assets for comparisons. Our VIX algorithms are related directly to volatility only.
Pairs Trading Techniques.
I am the most convinced user of our algorithms, especially with their unique ability to perform with inversely correlated ETF pairs trading.
If you trade them as I do, you can sit back with confidence, but you will have a decision to make at some future date and I want to give you all the answers.
Whether you are trading one pair or many pairs with our algorithms, you will come across a time when we will signal you to sell the second side of a pair after you already have previously sold the first side of that same pair.
There is no decision to make here because our algorithms are predicting that neither side is in a strong position to go up tomorrow and that the likelihood is they are not a strong buy. I have found no reason to override this decision.
However, the odds are that one of them will go up if for no other reason that leveraged ETFs are correlated to move in 100% opposite directions when the market opens tomorrow.
It does not mean that when the markets close tomorrow, they will still be 100% inversely correlated but it will be very close to 100% and not mathematically worth any risk. So, if you only own 4 of your 5 pairs or 9 out of your 10 pairs, it is better to hold the cash because time will normally be short.
Next, you will come across a time when we will signal you to buy the second side of a pair after you already bought the first side of that pair.
My recommendation here is to follow the signals ONLY if your account has available cash to make that additional buy without bumping up against the Banking Rule of T+2 days.
Only one side of the pair will go up tomorrow and the small odds favor the side that is currently making the most profit. Unfortunately, the side that goes down will still lose almost the same amount.
My second recommendation in this situation is to sell the first side that you previously bought rather than buy the second side and to wait for a definite signal.
Therefore, I am not undecided. It depends on cash available in my account and my trading mood on the day. The profit difference is very small, and commission costs cancel each other out. I will be effectively neutral whether I am all in or all out.
Simple, Proven, Current & Profitable.
Simple � you get daily emails and/or texts with simple convenient instructions to buy or sell at the opening price any time before the markets open tomorrow.
Proven � you can see a great deal of pre-published trades continuing today, with graphs and charts of every trade placed at opening prices that can be confirmed.
Current � you will receive 30 days of free trades for you to follow exactly how our algorithms will work for you.
Profitable � If the system does not pay for itself within 30 days, I will send you another 30 days until it does.
Simple because 5 -10 minutes in an evening is all it takes to receive our direct instructions to Buy or Sell or do nothing.
We run all our algorithms beginning at 3:00 pm Chicago time every day and send out their instructions to you in the early evening. From my own personal experience, I enjoy the freedom of not being tied to more extensive decisions, but the real pleasure is knowing that in the longer run, they quickly adapt to the changing conditions and news cycle.
Proven is a matter of seeing results for yourself every day but also reviewing the individual charts and historical data that continues to be published before any trades need to be made.
Currently, I just looked at some live charts that we occasionally publish for followers and offer these observations representing the last 6 months.
Our RATIOS chart shows that our winning trades make 3.92 times more profit than the losing trades.
Our UP chart shows a total of 732 trades with 54% of those trades ending up on the first day and a FIRST DAY ONLY profit of 2.5%.
Profit comes in various ways and for us, our WIN chart shows that 67% of our trades end up with a profit.
MIX 3x versus IM 3x Groups.
We often refer to the fully correlated 10 IM or (I)nvestment (M)anager groups that we initially worked with using our Booster algorithms.
Here are more details for the 10 Mixture groups that we include on Chart 1X and which are currently performing well.
Correlated inverse pairs with enough volume are in limited supply. Our primary goal is to use available ETFs to match and correlate with professionally selected portfolios that are currently preferred.
Mix or (Mix)tures are selected from ETF pairs that are NOT included above.
Limited supply does not mean limited trading volume. Some of these ETFs represent huge volumes and are held and often preferred by managers of the largest portfolios. They represent a fast-growing industry and group of assets that save management costs when compared to Mutual Funds.
Our MIX groups, unlike the IM groups, do not represent any special selection or concept.
However, we do split both the Mixture group and the Investment Manager group into two types of investments.
The first split is by solely investing in the 10 bullish sides of each pair. After a Sell signal, they remain in cash until the next Buy signal occurs.
The second is by investing in both sides of the pair at different times, commonly known as Inversely Correlated Pairs Trading. This offers the advantage of trading in both directions. These pairs are most often 100% inversely correlated and have the advantage of one side going up while the opposite side goes down.
Our algorithms are completely independent and occasionally buy or sell both sides of the pair during a day or two of indecision.
Some followers will adopt the concept of never buying both sides. On the day that a second buy occurs for any pair, they prefer to sell the side they already own, rather than buy that second position. Either way puts you into a neutral position for that pair.
Dow January High $26,616 Being Tested.
A couple of days above and a couple of days below. While the Dow is probably the most watched index, others have ploughed through old highs and we appear to be resuming a positive trend.
Volatility is low, and many individual stocks moved ahead today giving our Best 5 group a nice boost.
Our average group from Chart 1X is currently up 74% from early March while the S&P 500 is up about 8.7%.
Eight times better than the S&P is a good place to be although recent activity has been slower.
Risk is a large influence on our efforts going forward and all groups benefit from the rapid ability of our algorithms to bail out of reversals. Recent activity seems to have seen too many reversals with indecision in either direction.
The smooth upward trend of our charts demonstrates the value of looking at tomorrow and not waiting for trends to develop.
When trends do develop we either stay in or stay out except in the case of inverse pairs trading where we participate in every trend whether it is going up or going down.
Our groups have also maintained their rank in terms of profit with the Best 5 stocks staying at the top. These 5 are chosen from the entire range of US stocks or ETFs each month and all generally have a recent history of strong upward movement.
We can put these strong performing assets in this small group because we have the confidence of getting out quickly. We have had a couple of surprises in the group. One was a takeover at a higher price which then sat at that price for the rest of the month and the other was an announcement of illegal activity by Company Directors. Not good and both are difficult to put into an algorithm.
October Changes Next Monday.
We review our algorithm choices every month based on Professional Investment Managers, current trends and recent performance.
Investment managers have made few changes in their portfolio mixes and confidence remains through 2019, mostly due to recent tax bills helping subsequent earnings growth and share buy-back programs.
Interest rates are slowly rising but political news is still causing some erratic market days. We will have no changes in the IM Bull 3x and IM Pairs 3x groups.
We do expect to eliminate the UGAZ/DGAZ pair from the MIX Bull 3x and MIX Pairs 3x groups and replacing them with the ERX/ERY pair. This change keeps the pair in the energy field but should offer greater returns.
We are also reducing the US stocks from 7 to 5 which will eliminate the Best 7 US Stks group but will retain the very popular Best 5. This group can include any of the bullish stocks or ETFs that we follow and retains the highest annual return status.
Finally, we have eliminated 2 of the 7 stocks to make way for another Volatility Pair. We still have followers who like volatility and who miss the very popular Inverse ETN (XIV) that we used to follow. We will be returning with an additional inverse pair UVXY/SVXY.
The VIX Volatility Index is a mean reversing index that always eventually returns to an average annual value. It operates as a market indicator and the derivatives, such as futures and options are important hedging vehicles in use in high volumes every day.
Seasonality and Trading.
Maybe we should be pleased to see the end of summer vacations as various statistics show August and September to be difficult months for trading and for algorithms.
We did a quick sort of our ETF trades by date and found the recent high point for our algorithmic trading this year was Friday, August the 17 and the low point was almost a month later at Thursday September 13, with a slow improvement since then.
Still not back to normal but enough to confirm the widespread hope that Fall to Christmas is often seasonably good.
We have found that historical data up to about eighteen months is useful to us but anything beyond that is not. At different times, back-testing shorter or longer periods can improve results, but we have settled on algorithms for all seasons with steady results.
Initially, we often made changes, but it was too easy to fall into a trap of making too many variables that slowly became overwhelming. My Grandfather was a Spiritualist and I could have used his help, but he died before I was born.
We are always looking for the next recession and climbing the so-called wall of worry, but we have two of the best defenses against those future surprises.
The first of our defenses are the algorithms. They quickly get you out of reversals. Sometimes too quickly and sometimes too late but as we solely concentrate on what may happen tomorrow, in the long run, they make good average decisions.
For simply investing in bullish markets and trends, these algorithms will keep you in the trend or in cash until a resumption of the trend continues.
The second defense that works in your favor are the relatively new ETFs and especially, the inversely correlated pairs of ETFs. Our algorithms are direction-neutral. It makes no difference whether you are in a bullish or bearish trend, they will signal a reversal out of your trend with equal accuracy.
Consequently, when the wall of worry comes to an end, the algorithms in conjunction with inverse ETFs, will get you out of the bullish trend and put you into the opposite bearish trend, often on the same day.
With these inversely correlated ETFs, you can ride the profit on the way down, rather than sit with cash in your account.
There are statistics that show that bearish markets are steeper and faster, but once you are invested in that direction, your account will move with whatever the trend gives you. However, you are usually in the bearish trend for shorter periods of time due to the natural upward movement of assets.
ETFs that we select are a growing and much preferred asset for institutions and large accounts and the volumes offer much lower bid/ask spreads that benefit your trades.
From Chart 1X below, the IM Bull 3x group is currently running at 76% annual return whereas the IM Pairs 3x group is at 118% annual return. That adds up to a 55% improved profit from the pairs.
Also, from the same chart, the Mix 10 Bull 3x group has a current annual profit of 83% and the Mix 10 Pairs 3x has 127% which also adds up to a 55% improvement in annual profit potential.
Bankers � A Special Group.
Although we may concentrate on the high profit groups and their results with our algorithms, it is worth reviewing our Historical Data website page along with Chart 1X, where you will find our original and always available algorithm groups.
Look at the IM Bull 3x trading log and the IM Pairs 3x trading log.
Through 8 years of history, including 3 years of published prior-day trades, we began by selecting assets based on professional world-wide (I)nvestment (M)anager portfolios. Hence the designation IM in front of those groups for you to identify.
Chart 1x at the top of that page lists various portfolio groups that we currently make available to follow. Note the IM Bull 3x group currently has a profit of about 42% and an annual profit of 77%.
This group consists of 10 bullish-side 3x leveraged ETFs that as a group, correlate closely to the above professional portfolios including Fixed Income.
If you scroll down the page to the last but one chart, 1DC (Investment Manager Bullish 3x Booster), you will see the 6-month history and trades for this group.
We publish these charts every month with trades going to subscribers every evening for their next-day trades. Results through September 2 have about 41% current return and 83% annual return.
Scrolling back up to chart 1GC (Investment Manager Pairs 3x Booster), you see the 6-month history for that group also. This pairs group shows the same period results of about 64% current return and 131% annual return although the current annual return from Chart 1X is at 119%.
This pairs group consists of the same 10 ETFs above, plus their 10 inversely correlated partners, creating our 3x Leveraged Investment Manager Pairs Booster group.
Perhaps you could benefit from setting aside a small account for the next 6-12 months and have your account manager receive and trade our daily signals for one or both groups.
Our Broker commissions costs of $3.49 per trade are listed but may not apply to you. They currently average 14 round-trades per year per asset in both these groups. Obviously, they are fungible across different account values and the same would apply to our signal fees following our free 30-day test period.
A final comment. If you compare the graph portions of both groups, you see higher results from the inverse pairs trading, but you also see a more gradual and smoother profit performance when taking advantage of inverse pairs.
Click here to add your email address to our free trial so that you can test and confirm whether our Boosters would work for you.
Performance Ratios Updated.
Finding a trend in anything is done with several types of technical analysis such as Macd. The trick is then to choose the best time to get in or out of a position.
Changes in market conditions such as local or world economics can change the length or direction of the trend.
Our method of inverse pairs trading normally behaves like finding a Macd trend except we may find more of them.
By concentrating on tomorrow, we find more trends than end up coming to fruition, but the following Ratios Chart confirms our winners beat our losers.
Winners are currently close to 4.6 times more than the losses.
A good way of visualizing this may be the difference between Day Traders and Investors. They both can use the same Macd techniques but with different timelines.
The Day Trader is using 1-minute price intervals and the Investor is using 1-day intervals but they both buy and sell the same trade indicator.
Our algorithms are a little of both. They judge what is going to happen tomorrow but keep repeating the same calculation every day. The trend is measured and acknowledged every day, or it is quickly rejected as a direction change.
The consequence is we sometimes have extra blips by getting in and out because some short-term condition messes with our algorithms.
The advantages are we participate in more trends but get out quickly.
Another advantage with inverse ETF pairs is we participate in trends in both directions so most of the time, when we sell, we also buy in the opposite direction.
In addition, the rapid daily decisions enable the trading of highly leveraged ETFs because they easily overcome the rolling daily management losses that are typical with these assets.
Risk, ETFs and Algorithms.
Risk is the first decision on your mind, whether you are investing your excess cash, your IRA, some money belonging to your favorite Aunt, your friend or client.
I have experienced all these situations and have usually taken the responsibility more seriously when it belonged to someone else.
These came to mind when I first started to try to use my career experiences to better invest my own personal IRA.
During the first few years, as partial successes turned up, I sometimes bent the rules to take advantage.
But, about three years ago, I first decided to find a more perfect way of selecting which underlying assets I could use to better take advantage of them. That is when I became convinced that big money was a much better source for the stocks than I could possibly do myself.
By saying big money, I am not referring to Warren Buffet or George Soros. I am talking about the money managers of large institutional portfolios for the largest of accounts, whether they belong to international bankers or individual nations.
I was able to review a few of these and produce a compilation of their general investments and boil it down to percentages of broad types of assets. The simplest division was stocks or fixed income, but it starts to get a little trickier after that.
For example, changes in anticipated trade and economies, as well as expectations for major nations and sectors, along with their expectations for future activity are beyond my pay grade. Interest rates, inflation and trends derived by their experts help them to take that middle road and make many small adjustments.
They can choose international stocks from US large cap to emerging sector small cap. They can also choose from long term floating rate notes down to short term overnight notes and everything in between.
In conclusion, I found they do adjust their holdings as indicated, but taken as a group, they seem to fall in line with many types of assets and many of the same assets. The fast rate of growth of ETFs and ETNs is becoming a preferred place to put those funds.
These Exchange Traded Funds and Notes can cut 1% off the cost of managed Mutual Funds and considering that 100-year returns are often quoted between 8% and 12%, this 1% advantage is quickly gaining favor.
So, after creating our percentage-based investment model and updating it every month, we select a set of 10 ETF inverse pairs that correlate better than 95% with our model Investment Manager Portfolio.
This now has become the source of our sets of 10 assets which all work together with our algorithms to form a well-balanced professionally selected portfolio. IM in the group names on Chart 1X below means (I)nvestment (M)anager.
Algorithms in the Wrong Direction?
The great example of how our algorithms work is best seen on the pairs details at - Best 5 Inverse Correlated ETF Pairs.
With inverse pairs, half of them are always going in the wrong direction while the other half is going up.
Please look at the link on the left and scroll down to see 1 year of back-tested results on all 10 ETFs. You just need to look at the charts for TQQQ and SQQQ.
When TQQQ trends up, our algorithms go with the trend but when TQQQ became undecided, we increased the annual results from about 50% up to 200%.
During that same period TQQQ itself only went from about 50% to finish the year at about 80%
Now move down to SQQQ and see what happened there. While SQQQ went down for the year with a miserable loss of 60%, our algorithms managed a 40% profit. Also, impressive.
Below each graph is the history and dates with opening prices on each date that our algorithms signaled to achieve these results.
Each additional pair has similar charts to show their individual results in a one year back-test, but you can also see current results that are published every month on the Historical Data page. The same exact algorithm is being used every day to signal followers trades each evening.
Equally important are the individual charts for the Best 5 Stocks/ETFs group. They also demonstrate the action of the algorithms on a preselected bullish-trending group of assets. The difference is that these stocks were selected because they already were in a strong bullish trend.
When assets are already mostly going up, the algorithms stay with the trend but improve results when opportunities exist.
Additional information.
Below are samples of the new charts sent out each evening. We have added the signals for yesterday along with the new signals for today.
It is easier to see changes from current positions each day.
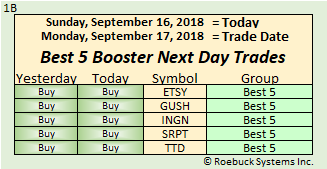
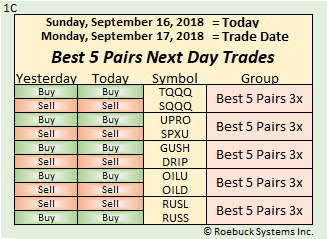
30 Days Free and No Credit Cards.
Difficult to believe so why not paper-trade for 30 days FREE of any charges.
Watch yourself making a profit in 30 days or I will give you another 30 days. Follow my trading experience.
Trade both the Best 5 Stocks/ETFs and Best 5 Inverse ETF Pairs. I trade them both every day.
I will add your email address to the Free list for 30 days. You can watch it happen.
Receive an email every evening with instructions what to Buy or Sell when the markets open on the following day.
You can paper-trade and see potential profits that you could have yourself.
The way to do it is to place your order with your online broker whenever you get the signals from us. There is no advantage in waiting until tomorrow morning to place them.
Do it all in 5-10 minutes in the evening and then wait until tomorrow night for your new signals and watch it grow.
We are not guaranteeing profits every day. Our algorithms are predicting tomorrow only and most of the time they pick the correct days to buy or sell. We use math and statistics so please take a look at our longer-term results. You do not have to watch the markets every day or all day long.
When you do watch the news and the experts all day long, it can be more exciting or more depressing, but far better to enjoy watching the markets at your leisure rather than watch all day long, unless of course, you are a professional trader.
As I said above, if your account does not grow to make the $29.00 monthly fee in 30 days, I will send you the signals for another 30 days until you do. This is a long-term system of profit-making and not a get rich overnight tip.
Our tips come every evening on a regular schedule, and if you look at our history, you can match our charts.
More Statistics for New Followers.
The Blog yesterday gave some statistics that are useful to understand and today I am showing newer versions of the charts that analyze our history.
We keep all kinds of numbers to continuously watch performance so that we can tweak our algorithms if necessary. I should tell you that no changes have been made since last year and we see nothing ahead of us.
As we said yesterday, we are constantly looking at tomorrow. These three charts continuously measure 8 different Groups and their performance. I will add some additional comments here.
First is the Ratios chart. We start all groups on the same date so that we have good comparisons and March 5, 2018 is the latest with 192 days of history for each group.
Ratios tells you the profits and losses of each group since March 5. You can see that we have a running average for all groups at almost 5 times more profits than losses. They vary considerably but each group has a different story to tell.
This demonstrates the fact that we get out of trades quickly and do not stay in losing trades.
Next, we have the UP chart. This chart looks at winning trades as a percentage of all trades and is usually above the 50% level. More specifically, it tells you the quality of the BUY signals and the average profit on the first day of the signal. It generally runs above the 2% profit level on the very first day that you place your BUY trade.
All trades are recommended for the next market day at the opening price. Tradier Brokerage calls this a market order that is placed any time before the market opens. I say this because some Brokers have different words to express the type of trade you are entering.
At Roebuck Systems, we always start a group with $2,000 in each stock or ETF and in the early days this profit would be in the $40 plus range. At Tradier Brokerage, our commissions are $3.49 per trade so we stand a good chance of staying in a profitable mode.
The third and final chart is WIN. This chart confirms that we continuously make profits in about 70% of all trades.
We know from the Ratios chart that those 70% of all trades produce about 5 times more profit than we lose on the remaining 30% of all trades.
These results have changed little in the past three-plus years and while they vary in each Group, they have time-proven reliability across different markets and varying market conditions.
We Only Look at Tomorrow.
We concentrate our computers to look at tomorrow and we only start looking at 4:00 PM today, New York time, when most of the financial information for today as well as most of the news is already known.
When many trading systems and related algorithms are looking for longer term activity and economic news, we are just looking at tomorrow.
Seems a little strange if you are usually thinking of trends and economic conditions into the future but we want to be correct about tomorrow. Our average buy signals historically gain about 2.6% on the first day.
Just as important, when we first issue a sell signal, we end up with 70% winning trades.
Also, our average losses are much smaller than our gains which shows up in the individual charts on the group pages.
One good reason for these statistics is our ability to trade the inverse pairs in the opposite direction for more profits instead of holding losing trades until markets return to a bullish condition.
By concentrating on what will happen tomorrow only, we are not letting markets beat us up for long periods of time. We get out quickly if we are in single trading mode like the Best Stocks/ETFs group.
In similar fashion, we very quickly move into the opposite direction trade if we are in inverse trading mode such as our Best 5 Inverse Correlated ETF Pairs group.
Commissions Listed on Charts.
Some of our algorithm groups make more trades than others and it may be helpful to compare the differences.
The bigger problem is that the Brokers charge various amounts and it can make a difference to results.
Our master accounts are with Tradier Brokerage who charge $3.49 per trade and we use them to calculate commissions listed on each chart. We show totals as well as percent of profits below each graph and listing area.
Interactive Brokers is another of the brokers that we use, and they charge about $1.00 per trade even though their site is more sophisticated and has more trading ability as well as it being an international company.
Chart 1X shows the commissions as a percentage of profits for each group with an average of 7%. The more profitable groups are as low as 1%.
8 Pairs are Undecided.
Inverse pairs are supposed to tell which direction you are going in tomorrow.
Our algorithms look at all the data available each day and tell us which side to buy and which side to sell. You would expect them to be decisive each day.
We currently offer those decisions on 21 inverse pairs if you include volatility and 9 of those pairs are either both buys, or both sells. Can we know anything from these numbers to improve results?
Yes, but difficult to act on it. Apparently, they are close to a decision, but find it is too close to call. Very frustrating and always an irritant when you place your orders for tomorrow morning.
From previous experience, it appears that indecision can be handled in a couple of different ways.
First, if you have a buy signal for both sides of a pair, you could simply go ahead and own both. There is some evidence that although they will move in opposite directions at more or less the same rate tomorrow, in the long run, you may make slightly more profit because the gain will out way the loss.
Second, if you have a sell signal for both sides of a pair, you should just go ahead and stay out of both. Again, some evidence says that in this case, the losing side will be slightly more than the winning side and in the long run, you will lose less of your profit.
The ultimate decision, and this seems to happen a lot, is when faced with the decision to buy the second side of a pair, you run up against the T+2day Banking Rule and may not have the buying power allotted to the program.
This mostly happens if for example, you are following our Best 5 Inverse ETF Pairs group and you already have 5 positions in your account. Now here comes a signal to buy position number 6 and you only planned for 5.
In this case, it may be better to sell the side you already own, if capital restraints in the account force you to wait a day or two, instead of buying the new signal. In this case, if the account is not restrained by the Banking Rule, then it is probably worth staying in the trend and buying the second position.
You have effectively put your account in a hedged position regarding this pair and that often works out well also.
Every time this decision is required, the circumstances are different and having a plan ahead of time, is always a good idea.
How to Spread Your Account Value.
There is more than one logical way to spread your account value amongst stocks or ETFs.
If you have reviewed our historical charts, you would see that we invest an equal $2,000 in each asset on the same date and reinvest the previous sale value.
That decision was made because we want our followers to be able to compare each stock, ETF or group of assets, as it performs against all others over the same period.
However, in our original Investment Manager groups, we specified that an equal value should be invested in each of the 10 ETFs.
The reason we recommended that approach was first due to the way we selected the 10 different assets in the group.
Our monthly analysis of various world-wide professionally managed accounts is reduced to a percentage, allowing us to select 10 ETFs that correlate as much as possible, with their current investments. I have commented before how similar their accounts are. Often, they have large values of the same asset, especially if you compare ETFs, which are more efficient than holding stocks or mutual funds.
From the above description, you can now surmise that a more precise way of following our Investment Manager groups, would be to invest 10% in each of the 10 individual assets or 10% in each inverse pair of assets.
The 10% should be maintained as closely as possible as the account grows in value so that it retains the relative selection of assets.
Remember that we are adjusting our set of 10 recommended ETFs, to maintain what the professionals are currently buying, and you will see an occasional change in the list that we publish each month.
For instance, one change you might notice would be less quality and volume of stocks or changes in fixed income ETFs. It is not a precise selection, but with correlation, we maintain the percentages as much as possible.
A final thought brings us back to the two benefits that we offer. The first is our algorithms that keep us out of reversing markets and the second is the availability of very highly inversely correlated ETFs that allow profit in both market directions.
Current Market Focus . . . Part 2.
Tonight, you will see the current market focus of our followers as well as ourselves in our website simplification.
Without wasting too much time here, the most successful use of our algorithms is more readily seen in the Best 5 Stocks/ETFs and the Best 5 Inverse Pairs.
The first group is quite straight forward and consists of our best currently performing stocks or ETFs that meet our volume requirements and have demonstrated good performance with our algorithms. The current actual profit is 135% and the annual profit is currently at 267%.
The Best 5 Inverse Pairs needs some further explanation.
The traditional Pairs Trading involved the selection of two closely related assets that moved in similar ways and profits are made by trading the differences in their relationship over time.
For example, as they moved apart from each other, you could simultaneously short sell the higher valued stock and buy the lower valued stock. You then close the position as their values came back into line. No matter which side of the pair moved the most, the net difference in value represented your profit.
ETFs have simplified and expanded this opportunity due to their availability in exactly opposite versions. In other words, if ABC moves up 5%, the inverse ETF moves down 5%.
Sometimes, this relationship is with exact 100% opposite correlation and sometimes it is less. The other advantage is the leverage that can be built into these ETFs.
For example, there are ETFs that reflect various sectors that can move at 2x the value and 3x the value, in the same direction and in the opposite direction.
By trading from one side to the other, depending on the direction of the underlying sector, you can potentially profit every day by knowing the direction.
There is a daily production cost to this leverage which must also be overcome by the trading method. Our algorithms work to signal which side of these inverse pairs is likely to be the most profitable and we send out these signals every evening.
Current Market Focus. . . . .
It is no secret that our Best 5 Stocks/ETFs and our Best 5 Leveraged Pairs groups are exceptionally popular as well as offering exceptional profits.
Due mainly to our algorithms quickly getting out of losing trades as well ETFs that give us the ability to trade both directions, these two groups today are averaging 236% annual returns and profit.
The concept of carefully adhering to assets that correlate closely to professionally selected portfolios, loses some followers due to irrelevance.
We have algorithms that can double and triple fixed income returns, but they also compound the same results on 3x leveraged ETFs and ETNs.
Why convert a 10% return into a 25% return, when you can turn a 100% return into a 250% return. I must admit that 8 years ago, I was seeking the lower solution and had no idea that 250% would be possible.
We now have about three years of pre-published trades with these results. The latest series that we are demonstrating since March 5 th, for over 6 months have produced the above results while the S&P500 Index has produced less than 7.7% profit. We use common start dates so that comparisons between groups can be made and followers can see the actual profits as they are being generated.
In total, we have published eight different groups of stocks or ETFs that together have produced average annual returns of 138% but we need to advertise our best groups.
Obviously to produce these Best 5 trading groups, we research and follow all of the DOW, S&P and Nasdaq stocks as well as the full range of inverse ETF pairs that meet our volume requirements.
We have also added the Brokerage Commission costs on our published charts from Tradier Brokerage. By the way, you can obtain 60 days or $200 of free trading commissions by opening an account using the code � Roebuck200.
We suggest opening a MARGIN account to eliminate short term T+2 Banking Regulations but do not recommend normal trading with margin funds. Tradier Brokerage charges $3.49 for each trade. We have no relationship to them other than running some of our own accounts with them.
To be fully transparent, we also have accounts with Interactive Brokers where commissions are less.
Investment Manager Focus.
As a lifelong second job after being an Engineer, my investing was always interesting to me, intense but amateurish. Now I have the time and access to see what professionals do and they do it very deliberately and often in similar ways, all around this world.
I decided to analyze their portfolios and see just how they nurse hard won capital. Not surprisingly, I have a current chart and I update and review it every month to see if an engineer can improve on it.
Yes, and in two different ways as follows and I will explain them very quickly.
Algorithms, just like charts come naturally to an engineer and the item that stands out in those portfolios would be to find a better way of buying and selling at the best time.
I found the best time to buy or sell more efficiently was to study tomorrow morning when the markets open. Longer periods of time complicate the issue and a single goal helps concentrate the mind.
Next, the best-informed time to make the decision is after most information is available after financial markets close today.
These Investment Managers have reams of data and rooms of computers to know about investing in every corner of the world. My analysis tells me they mostly come to very similar results, and I decided to accept their professional advice. I urge you to review how well our current algorithms work in the years of published charts.
The second way to improve these portfolios is a gift from producers of leveraged exchange traded funds. Using our algorithms with 3x leveraged and correlated funds takes advantage of the two ways I mentioned above.
First apply the algorithm and second, apply it to triple leveraged funds.
But there are benefits to this idea now you understand it. Portfolios are constantly changing, and we adjust our range of ETFs to make sure we maintain their advice. To follow exactly is not always possible, but not to worry.
To be the best follower, you would have to buy equal investments in all 10 of the ETFs but as it turns out, our algorithms are very good at getting out of assets whenever they change direction. Not only getting out but we now have the inverse ETFs that we recommend you buy. You now make profits in both directions.
By the way, the producer management losses on those 300% leveraged funds turns out to reduce our profits to approximately 250% on average trades.
September Lessons. . . . .but Labor Day weekend changes to site will continue.
My personal mantra, even though I am neither Hindu nor Buddhist, has always been, - There is Always a Better Way.
September is a better way and we have TWO ways of putting the brakes on.
Our contribution to this is our algorithms but the other large contributors are the producers of inverse and correlated Exchange Traded Fund Pairs.
The evidence of both are the charts of our pairs trading groups compared to the charts of the single direction groups. Both strongly resist negative moves, but the pairs groups make straighter lines.
It is worth comparing all graphs of the trading groups to see this fact. Look at the tendency to go up in a straighter line with the pairs charts.
But also look at the individual asset charts on the page of each group on this website and see how the algorithms do not like to go down when the asset does go down.
Not surprising that the current percentage of WINS or winning trades is 88% and highest for our Best 5 group. After all, that is how they became the best 5 in the first place.
Also, not surprising is the lowest current percentage of 60% which belongs to the new volatility pair and here is the reason why. Some math features that can move an ETF or stock do not apply to volatility.
Increased volatility can result from good news or from bad news and if I knew the math for that, I would certainly add it to the algorithm. Another indicator why volatility is different is the current first-day profit for new buy signals which is the lowest at 1.55%, when the average for all algorithm groups is 2.6%.
Many followers know that we once had a relationship with the Credit Suisse XIV until they took it away one night. Positive Roll Yield was the XIV main driver.
It is interesting to see the signals from the underlying VIX Index and we have included it for reference, but we do not currently match it up to a trading method.
Finally, note that Inverse ETFs often perform less than their bullish ETF partners, due to the historic upward direction of market values. We also get occasional minor changes to values due to after-hours trading and other late data feeds.
A Reminder . . . work will be ongoing until Monday night!
This Labor Day weekend we will be adding the September versions of our algorithms.
The non-leveraged Investment Manager group of 10 ETFs will be replaced by a mixed set of 10 leveraged 3x ETF pairs that represent a wide range of inverse and profitable trading.
The Investment Manager leveraged 3x pairs will remain and in total, when trading all 10 pairs, they still represent a correlated and professionally chosen investment portfolio.
The Nasdaq stocks will remain as a group of 7 of the best recent US stocks. A pair of volatility ETFs are included as well as the VIX Index as a reference.
All these changes will appear before the market opens on Tuesday and normal emails to subscribers will continue as before.
Risk from 1688 to 2018.
Lloyds of London started in 1688 in a coffee house in London by selling insurance on ships and their cargos.
Insurance became the huge business that exists today by taking a portion of profits and spreading it over multiple repetitive occurrences.
The Chicago Board of Options Exchange, with roots back to 1973, began the move to organized Stock Options trading where a portion of existing or potential profits, like insurance, could be based on a future time and value of Stocks or marketable securities.
Call Options could be wagered on profits and Put options on losses.
Earlier in this century, by using Options and Short Selling securities, Inverse Exchange Traded Funds (ETFs) could be generated that mimicked an index or security and would trade in the opposite direction to the underlying asset.
With developed expertise and computers, these inverse Pairs of assets have now become widely traded and with many Indexes, they are correlated to move in exactly the opposite direction to each other.
Not only the opposite direction but by adjusting their make up every day after trading is finished, they begin the very next day with a precise leveraged movement relative to the underlying asset. Leverage of 200% and 300% are quite common and now 400% is offered in certain markets.
Our algorithms concern themselves with which direction the ETF and/or underlying asset is going to move on the next trading period and recommend staying in the current ETF or switching to the inverse ETF.
As you can imagine, trading both directions of a zig-zagging price chart can multiply your profits considerably and using an asset that has 300% leverage has even more potential profits.
Risk of being in the wrong direction is the greatest advantage of these algorithms because they quickly determine the direction and follow the trend wherever it may go.
New September Pairs Perform Well.
GUSH and DRIP lead the new 10 inverse pairs for September and have a 100% opposite direction correlation.
When GUSH goes up 1%, we should see DRIP go down 1% and vice versa. This condition is corrected every night using Puts and Calls so that when markets open every morning, you can expect the correlation to be maintained.
This maintenance is part of the management cost that we must overcome with our algorithms and these highly leveraged ETFs.
100% correlation is not there for all ETFs.
However, all our new pairs do have this 100% opposite correlation except for TECL and TECS which are at 99%.
This is one of the reasons why they are expected to perform at a higher level, but also a reason why we do not expect to get 300% better returns on a 3x leverage ETF. As soon as you own these high leverage versions for more than 1 day, you incur this large daily maintenance cost for each additional day owned.
Our history shows that we gain better than 225% and the average is higher than that.
Option values can be quite volatile and include time value as it gets closer to the expiration date. Also, volatility of the underlying asset or index can push the price considerably higher or lower during a normal trading period. This will often happen if a news item hits the market.
Why Start all Charts on March 5th 2018?
Many questions but few good answers. We modified our website to include a wider variety of ETFs and my input was to start on that day so that followers could see everything grow just like we did.
We also wanted to start all different groups on the same date so that we had good comparisons between them.
It has now become a bit of an obsession so that the newer groups that we have offered at various times use the same back-tested algorithms so that they can also be compared to all previous groups.
We recently celebrated our 8th birthday when we started first with stocks and then volatility and finally to ETFs and ETNs. Finally, we will be including volatility again next month.
The most surprising results that we have found is that our basic algorithm concepts over the years, have worked well with many different assets and seem to be most suited to inverse pairs.
Any asset that is performing well also gains from the algorithms but often not as much as a relatively flat one.
Most surprising is their ability to stop trading relatively quickly when any asset reverses in the opposite direction. To that end, inverse pairs that are correlated at 100% opposite direction perform exactly equal in both directions.
No doubt we will have to change the March date soon and one thought we have is to renew the start date each month on a continuous basis. Six calendar months seems like a good way to go, but 3 or 4 months would be easier to manage.
One thing is sure. Our latest September groups represent the very best that we have put together and future changes are likely to be less often. Perhaps back to 1 to 4 asset changes each month.
September Additions Will be Ready.
When we begin publishing the September additions and changes next weekend, there will be several enhancements to our complete program.
I am somewhat hesitant to make too many claims. However, if you look at our individual charts for ETFs and stocks, you will see that considerable safety is built into them if reversals in direction occur.
That provides the opportunity to either stay bullish with the Nasdaq stocks or some ETFs but also makes the Inverse Pairs Trading a further profit maker by trading in both directions.
You may also notice that ETFs and their inverse partners that are based on indexes, often turn on or about the same day, whereas inverse pairs that are based on assets that are not so well defined may have different cycles.
Volatility is an example of a pair that moves by different rules. Gone are the days when we had a positive roll yield when trading XIV before Credit Suisse removed it.
Both SVXY and UVXY have management costs that must be overcome by our algorithms, but we will be including them next month. For those that like to follow it, we will also include the VIX Index in our signals charts for subscribers. Although the VIX cannot be traded itself, derivative traders may find it useful.
The addition of 10 more 3x leveraged inverse pairs, chosen solely for their profit potential will also be a part of the new month and included in our website Historical Data page. The back-test data will be available on the Historical Data page each month as well as the individual asset charts.
Nasdaq stocks will be reduced to 7 instead of 10 but their profitable inclusion continues as before.
For my British Followers.
The news this week reminds me of the days when I left Alfred Herbert Ltd in Coventry to take up Mexican Citizenship for the Bristol Aeroplane Company.
The news was all about The Profumo Affair but more realistically, it was about Christine Keeler, a Russian Diplomat and John Profumo, MP. This was the biggest scandal until then in the 20th century.
Little did I know back then that a year later, we would hire a man from London who lived down the street from Miss Keeler.
The names change but life goes on.
Planning for September.
We almost have all the new selections completed for our September Groups and these modifications and additions will enhance our offerings more than any previous time.
Volatility was our specialty prior to stocks and ETF pairs and we will be introducing a new pair as well as some interesting data concerning the VIX Index.
As mentioned previously, we will drop the non-leveraged Professional Investment Manager group but will concentrate on our 3x leveraged version of that same selection and concept.
That means a continuation of the 3x Investment Manager group as well as just the bullish side of that same 10-pair group.
This helps us to offer new opportunities and to introduce a completely new pairs group consisting of the best potential ETF Pairs that meet our requirements for trading. This selection will be in addition to the above pairs. We will also add trading data on just the bullish side of these new pairs.
Our Nasdaq group will be shortened slightly to 7 or 8 of the best Nasdaq opportunities and we expect to continue that group as before.
We then will continue our Prime 5 group, consisting of the top 5 performing single stocks or ETFs based on recent activity.
Another new addition will be a Prime 5 Pairs group which will also be based on recent activity.
The icing on the cake will be a pair of volatility ETFs along with the VIX Index data previously mentioned. Altogether, the groups will represent some of the best and safest potential opportunities available and we very much appreciate your continued support.
3x or 1x Investment Manager Portfolios.
No surprise that the 3x leveraged Investment Manager Group is preferred over the non-leveraged 1x Group.
The annual return is currently about 82% versus 24% but this is still way above many investment returns. Both groups include fixed income ETFs which are not the most exciting thing to watch.
While we will not abandon this non-leveraged group as our base, we do intend to take up less space with it next month and introduce more exciting pairs trading opportunities that are preferred by our followers.
With our algorithms applied, we get out of positions that reverse direction very quickly. We then use Inverse Pairs Trading to profit from the opposite direction.
The new pairs will represent across the board industries with good returns but will not duplicate the Investment Manager Group concept.
There will be no new fixed income pairs because the IM Pairs x3 Group will still be available in our total daily selections.
We will still be adding our new Prime 5 Pairs group next month. This offers greater returns while reducing risk through the inverse pairs method of trading.
Is it Fundamental or Political?
We sure did some trading recently and some of that seems to be weekends.
One traditional problem is to go home with cash on a Friday or a holiday weekend. Sometimes you can see that with enhanced volumes and price changes and I think it has been getting a little more evident lately. Is it political?
I also know that too much trading is a problem with many people and we are working on some changes, but I want to confirm some ideas that may be helpful to some Followers. You may be aware of these but worth mentioning.
First is the T+2 (Trade + 2 Days) Banking Rule. Eliminate this problem by changing your account to a margin account. Assuming you are not normally buying your borrowing limit, this makes it possible for you to buy on a day that might not have enough settled cash and the 5% loan rate for 1 or 2 days is almost negligible. IRA accounts cannot be margin accounts.
Next, I do also have an account with Interactive Brokers and they have very low commission costs. It is a more developed website for traders but can be simple for simple trades. However, I do like Tradier for their simplicity of operation.
Another question that crops up is � Why buy both sides when Pairs Trading? The answer is the algorithms are not confident of the next direction. However longer term, they tend to make more on the upside than they lose on the downside. This is not a major advantage and some Followers avoid this by selling their current position instead of buying the second position.
Finally, I want to confirm our position on RISK.
I have explained that if you participate in all 10 positions or pairs, you have a balanced account that reflects a professional portfolio. One or more of those positions is for Fixed Income and represents safety in changing market conditions. This is true in the Inv. Manager groups but not in the straight bullish groups. Picking and choosing amongst the 10 positions changes the balance between large cap, emerging markets and fixed income etc.
I do realize that the above point may not be relevant to some traders, and we do offer less balanced opportunities such as Premier and Prime 5 Groups.
It is natural to select the more profitable potential as long as you realize that the lower performing pairs tend to be fixed income and would be helpful in a falling market. However, our algorithms will tend to get you out of bullish positions as seen from the individual charts.
Algorithm Birthday � 8 Years Old.
We are celebrating our 8th birthday today. This was my official retirement date and move to Anacortes, WA where I started testing the original algorithms.
Back then I was just using stocks and options and quickly moved to ETFs and ETNs because of the variety being offered.
Initially, I was very concerned with the buy/sell spread and started with the SPY with the huge volumes and good trading statistics.
Options were my favorite, but the time values were messing up my numbers.
I soon latched onto the VIX Index and liked the fact that it always reverted to the annual average value.
Mathematically, that seemed to be a great advantage, giving some upper and lower limits to the movement over time.
While volatility produced a range of ETFs that trade with the VIX Index and inversely to that Index, much of the early work on our algorithms was done with various of these assets. Sadly, to many traders, Credit Suisse cancelled XIV overnight, after a drop of 84% on Feb 5, 2018.
We had started the algorithms on stocks and had continued with all 30 of the Dow Jones Industrial stocks because they offered a good cross section and variety of trading conditions. We had decided to move back to our home in Chicago in late 2015 and develop Roebuck Systems Inc. as a vehicle to further the algorithms.
The last few years have seen the advance into a much wider range of stocks including the London and European markets.
More importantly, our decision to concentrate on selections of stocks developed by professional money managers and matching those selections with reduced risk techniques.
This directly leads us to Pairs Trading of inverse ETFs that are close to 100% correlated to professionally selected portfolios.
Pairs Trading Versus Straight Buying.
Taking a closer look at Buy Trading versus Pairs Trading is worth your consideration.
The first chart 1DC below is from our recent straight buying in our Investment Manager Booster and ends up with a profit to date of 10.9% since March 5.
The second chart 1GC is taken from our IM Pairs Booster which trades the same ETFs but switches to the inverse ETF according to the signals given by our algorithms. This version ends up with 10.8% or roughly the same as the first chart at present.
The added commissions for Pairs Trading would be $185.
I am showing these 2 charts because they nicely demonstrate the more gradual increase in profits by the Pairs Trading during this 6.3% Bull market when trading the same ETFs.
Without the use of numbers, these charts show that while each group made exactly equal bullish trades, the additional 53 trades in the inverse direction, helped to provide a steadier income.
They also display the available insurance that exists when this 6.3% Bull market turns into a Bear market.
That is a main benefit of Inverse Pairs Trading when it becomes an investment for all seasons. Short term risk is minimized by the reduction in volatility of current profits and longer-term risk will also be eliminated due to their ability to trade the opposite direction without short selling and profits will accumulate.
Perhaps the only negative is the 39% extra trades, but this is a small sacrifice to pay for such a highly improved method of trading.
Of course, I am not going to miss this opportunity to point out that the current 10 ETFs if owned for the last year would have earned 10%.
If however, you had used our algorithms to trade in and out, they would have earned 23% and using the Rule of 72, your investment would double about every 3 years.
Professional Investment Managers.
We put great emphasis on our choices for investment. It starts with Professional World-Wide Money Managers.
We consistently analyze many of these accounts and search for ETFs that they currently include or that correlate almost 100% with their current investments.
In recent months, we have also selected ETFs that have inverse partners. They must also have enough volume to allow Non-Leveraged Inverse Pairs Trading as well as 3X-Leveraged Pairs Trading.
If we have a goal, this would be it, and we constantly seek to improve.
Our algorithms are now 7 years old with a well proven track record, but we do this for several additional and excellent reasons.
Experience tells us that Professional Money Managers around the world have the expertise and the depth of research to consistently provide potential profits of 6% to 14% for their account holders.
Many of them include a broad range of ETFs, some successful individual stocks and bonds and we emulate 100% of their selections with a range of 10 ETFs.
If you invest in all 10 of our selections, you are effectively invested in a Professionally Selected Portfolio because it correlates closely with their total positions. For example, 65% stocks, 15% fixed income and 20% developing markets plus cash could be their current mix.
We then correlate this mix with 3X Leveraged ETFs to add more potential additional profits. From their 3X leverage, we historically gain better than 230% leverage to our results but are currently higher than that.
Finally, we add the benefits from our algorithms which typically add 200% to 300% of additional profits to each group. ETFs that are moving up well on their own will not get as much parallel profit whereas others will benefit more.
As we have developed this Professional Manager approach to our selections and improved on that by emphasizing the much lower risk of Pairs Trading, our algorithms have continued to improve results.
We have reduced our coverage of individual stocks due to the minimized risk in Pairs Trading and hope that you give that a try.
We will introduce a Top 5 Pairs group next month which will not entirely correlate to the Investment Managers but will be taken selectively from existing positions in these portfolios and will represent the highest recent returns.
The Nature of Pairs Trading.
NUGT, the 3x ETF for Gold Miners took a hit today of minus -18% but our algorithms knew all about it. We are in the inverse DUST and we went up 18% today.
I do not normally follow the fundamental aspects of the stock markets and tend to leave that to the experts, but I do think this news seems a little drastic and is most likely telling us something.
Turkey managed to get into the news with currency problems that are being created but US politics still took most of the news.
World financial news used to move markets along with tragic earthquakes or major economic gains and losses.
Today and for a couple of months now, politics seems to be moving markets with equal importance.
Algorithms are not built for politics and we should not be surprised if we get some miss-directions but perhaps gold is the universal tell-all and is not reading good news today � at least early today, because markets tried to get back this afternoon, even though gold miners ended in the dumps.
The Nature of Pairs Trading.
Watching the various charts each day of the various groups that we follow, demonstrates the reduced volatility of the pairs groups relative to the none-pairs groups.
Whether we are in an extended bull market or a volatile market, the slopes of those charts typically show less variation and more straight-line growth.
This is a good indication of the overall benefit of using inverse ETF pairs as a strategy as well as a way of reducing potential risk from a purely buying bullish assets.
This type of investment was not available before the introduction of so many ETFs a few years ago.
With a method of switching between upside and downside moves, we can stay in the market most of the time and be making profits most of the time.
With this kind of strategy, then it pays to be in assets that have more than average movement, so that we benefit from the swings in both directions. Hence, our use of leveraged ETFs.
The Investment Manager group has huge volumes invested and traded every day and moves a lot slower than your average stock. However, it remains a great source of information as to where the great wealth of the world is being held.
Explaining Some Averages.
I am going to eliminate some numbers from the charts because they are giving a false result.
Example: - On charts where we show the average results from a Buy and Hold strategy and compare them to After Our Algorithms, the average number at the bottom of the chart reflects both sides of our pairs strategies.
This makes no sense because in pairs trading, one of them goes up while the other one goes down.
The other way that it makes no sense is trying to put a percentage gain from a negative number.
You can see several of these negative numbers in the Buy and Hold columns.
The more interesting numbers can be found in the Gain Using Algorithm columns where you will see no negative results. That shows that the algorithms create a gain even if the ETF or stock went down during the past year.
This very notable fact shows that our algorithms are very selective in picking out the up moves but generally staying away from significant down moves.
How to Minimize Risk.
One great advantage of our algorithms is their ability to work well with any ETF or stock. But that is only part of the story.
If you study all the inverse ETFs, along with their bullish partners, we occasionally end up being invested in both sides of the trade or in neither side of the trade. Why is this?
The algorithms work independently on each side of the trade and calculate the strength of each potential move and profits that can be made.
One of the most common questions is why be in the bullish trade and the bearish trade at the same time. The answer lies in the potential of each side of the trade.
You are likely to make more profit from the side that may have historically worked best, and the net difference will be a smaller gain than normal, but still a gain.
The opposite is true when both sides indicate a sell, and in that situation, we are better to be out of both positions.
However, these conditions generally only last for a day or two and any cash should be retained and ready for the next buy signal.
Sometimes, if you have an IRA or none-margin account, and do not have excess cash in the account, you could decide to sell your existing position instead of making the second buy into a pair.
Doing this may avoid the T+2day Banking Rule and we are all limited to 3 of those warnings each year. The bigger problem is that your order is automatically cancelled before the market open and that always annoys me. I suppose that is the price we pay for cheaper online Brokers.
Further to the notation on chart 1X this weekend, we do have a strong move to lessen risk soon with something I am calling - Prime Pairs. We realize that holding all 10 positions from a group is not always possible or preferred by our Followers.
With that in mind, we are in the middle of testing the best 5 pairs and will introduce it by September. This will lower the investment down to 5 positions if you want to cover them all.
Often noted by us is the reduction in risk when following a pairs strategy such as our inverse leveraged pairs. While we use mostly 3X leveraged ETFs, we end up more than 2X the potential profit but less than 3X. The reason is the excessive daily management costs that the producers have in maintaining the daily leverage.
In adding this new group, we will replace the Premier group with the Prime Pairs group, but it will still be available to Subscribers through our normal publication of the bullish side of the Pairs x3 Group and our complete list of all 50 algorithms.
Simply Follow the Signals.
Had a good question today about the best way to use our algorithms.
I have some of this problem myself as I have sometimes switched between the groups and regretted it the next day.
The answer is to first pick the group you are comfortable with. This is likely dependent on your experience and risk level with trading. From our current results, all groups are profitable even though the individual risk for each ETF or stock is different.
This is why our whole program is defined around 10 completely different assets in each group and our basic Investment Manager group represents assets that broadly represent current professional portfolios of Stocks, Bonds and ETFs.
Whichever group you choose to follow, you will receive signals on all 50 of our ETFs and Nasdaq stocks every evening. You can then simply follow the signals to place your orders with your Broker anytime before the Markets open on the following day.
See details of each group on the website ranging from the basic Investment Manager group of 10 ETFs to the Prime 5 group of 5 top performing Nasdaq stocks.
Both of the pairs groups each cover 10 pairs of inverse ETFs that always trade in opposite directions. This means that you will normally only be in one side of each pair. On a few occasions you may be in or out of both sides of a pairs trade.
What Happens if You Choose 5 Pairs.
I am always looking for an edge and the following chart shows what happens if you select the Top 5 of the - Pairs x3 - performers instead of all 10 pairs.
Say you invest a total of $5,000. This RANK chart indicates what happens if you just invest in the Top 5 performing pairs according to their recent profit.
As you can see, we ranked the top 5 according to their combined pairs profit and then invested in each pair according to that same profitability. Now look at the results.
The right hand three columns tell you that when selecting the top 5, you should increase your profit potential by an additional 41%.
We do not recommend this but if you just selected the single top performer and invested all $5,000 in it, you would increase your profit potential by 422%.
Sometimes the math makes it all look very tempting and that is why I got into card counting some years ago, but the shuffling machines put a stop to that.
Subscriber Suggestion on SUB Chart.
Some very positive numbers have been added to our SUB Chart based on one of our Subscriber suggestions.
The 2 right-hand columns on the SUB chart now display new very interesting information not previously available.
First is the profit for each current Buy since March 5 2018 and the average at the bottom shows about 89% winners.
Second is the profit for each current Buy since the latest Buy Signal and the average at the bottom currently shows about 79% winners.
I very much appreciate this suggestion and regret that we did not include it before. I do get complaints that there are too many numbers to follow and choose from.
The 89% winners since March 5 should give confidence to anyone but a minimum of 3 positions and preferably a minimum of 5 positions is my suggestion.
By applying our mathematical algorithms to ETFs that correlate with professional money managers, we can get these results.
Inverse ETF pairs trading with these same selections is best reviewed over extended periods of time. In any established downside market, we will see the benefit of the algorithms in both directions.
Thanks again to our Subscriber for this addition and short of sending you a copy of our algorithms, we do appreciate any questions you may have.
You can use the � Contact Us � page to get an answer from us.
Numbers You Need to Know.
You would think that our Pairs 3x group would make 3x the basic Inv. Manager group due to the leverage of their ETFs.
Currently our algorithms are making over twice the profit but not three times the profit.
This is further evidence of the large costs that we are paying every day to the producers of the leveraged ETFs for their daily re-shuffling of options to re-value and start each new day with 3x leverage.
It is impossible to use a buy and hold strategy for these leveraged assets.
The good news is that our algorithms make approximately 225% based on current results.
Alternatively, you could say that they are losing or charging approximately 75% for providing the instant 3x leverage every morning when the markets open.
Of course, we do not hold these ETFs all the time so the 75% is the loss only for the number of days that we own them. However, we can project that the same average percentage loss might be for the whole year. We can also say that we would make the same percentage of 225% gain each year also.
One additional number you should also know is that we use the ETF with the symbol SH twice in our none-leveraged IM pairs group. The reason for this is a shortage of suitable inversely corelated ETFs to make up the group. This causes us to start trading it with double the initial investment to balance the bullish ETFs with their bearish partners.
August Changes to Nasdaq and ETFs.
10 Nasdaq Stocks are removed. (Sell) -
ALGN, ASND, BZUN, FMI, GDS, LOXO, MTCH, NFLX, NTNX, SEDG
10 None-Leveraged ETFs are added to create Pairs Trading Manager selection -
DOG, EUM, EFZ, SJB, RWM, PSQ, SH, TBF, UDN, SH (added twice)
14 ETFs are replaced -
DRIP, FAS, FAZ, FXI, GUSH, IEFA, IWD, IWF, LABD, LABU, VWO, XLF, XLI, XLV (Sell)
14 New ETFs are added -
DIA, EEM, EFA, HYG, QQQ, SPY, TLT, UUP, SSO, SDS, UCO, SCO, UDOW, SDOW
Also, here is the full selection of all 50 ETFs and Stocks. Blog continues after Chart 4A
Why are these changes being made?
First, we are adding the opportunity to Pairs Trade the original selections that represent the professionally selected portfolio of 10 ETFs. To achieve this and maintain close to 100% negative correlation, we had to exchange 8 of the original 10 ETFs with matched pairs that meet daily volume requirements.
You will see that this provides less risk with more even profit potential. Please review our back-test charts (Old) 1DC and (New) 1GC displayed here.
Second, we had to remove 10 of the 20 Nasdaq selections to make room for the added ETFs listed above. This improves the profit potential for the Nasdaq selection as the Top 10 reflect better performance. It also removes the trading problems with having too many selections.
Third, we have replaced 3 of the 10 leveraged pairs with 3 new pairs that maintain better alignment with our professional Portfolio concept and will also maintain better inverse correlation.
Finally, in line with our instructions, ETFs and stocks that are no longer being followed by us, should be sold at the next market open and replaced with new selections that have a signal to buy.
Normally, new monthly portfolio changes involve just a few assets, but this August represents many more than normal. We are confident that these changes offer less future risk and will be well worth this initial change.
Investment Manager and IM None-Leveraged Pairs added
Corrected Prime 5 chart due to only 5 stocks at maximum of $2000 each = $10,000 max investment. Review and send signals out tomorrow evening.
Changed name and added Inv Mgr 3X Leveraged pairs page. Includes historical back-tested charts.
Just added new page for Inv Mgr None-Leveraged pairs page. This will allow inverse pairs trading of the basic selections that we make based on professional world-wide Investment Managers.
Several additions to the Blog will be added this weekend
The August ETFs and Stocks will appear this weekend and some explanations will be necessary. You will now be able to Inverse Pairs trade the Investment Manager selections with a new set of inverse none-leveraged ETFs.
You will also be able to Pairs Trade this same Investment Manager selection with leveraged ETFs.
This will necessitate that we reduce the Nasdaq whole market selection back to 10 stocks.
Changes will run through the weekend until the Sunday night signals are distributed. Thanks for your patience - Malcolm
Can I Trade my IRA Pension Plan?
The simple answer is yes, assuming your Broker offers IRA accounts.
The obvious advantage of IRA accounts is that the profits are not taxable until the funds are withdrawn from the IRA account at the taxable rate at the time of the withdrawal.
There are also disadvantages. First and foremost, any Pension Plan generally invests long-term savings for many years to provide income for retirement. If this will be a primary source of income, then our conservative investments may be more appropriate.
Another disadvantage is that IRA accounts cannot be Margin accounts, and regular accounts occasionally bump up against the T+2 Banking Rule. This rule requires 2 days for cash to be settled and can sometimes prevent a trade if rapid reversals in trades are required.
Most of us have careers that do not include investment knowledge but have educated ourselves to varying degrees because Pension Plans have become self-directed. We have been forced into this arena due to necessity.
I began developing our algorithms to work with established professionally selected assets that would take the stock selection out of my own hands. We specifically research these managed portfolios and find they often move together as though some themes are common to their work.
For some of us and I put myself in this category, this was an interesting second job and we have become broadly knowledgeable if not always successful.
I have always involved myself in investing but also had my career to take up most of my time. It wasn�t until retirement became a close reality that I realized my background could be complementary to investing.
I really enjoy it just as I enjoyed my whole career and spreadsheets, formulas and statistics are in my personal wheelhouse.
Remember this. If you could make 18% annual profit, you will double your retirement fund every 4 years.
Why we Missed GDS.
A problem exists when we design our algorithms for the anticipated direction tomorrow and then the daily news cycle reports a possible fraud case against one of our selected assets.
As you probably noticed yesterday, GDS took a large hit for this same situation and it traded below recent lows on the day before that.
Unfortunately, this situation is not built into our algorithms and the odds of it happening are so low that it would be difficult to include it, as we rely on mathematical and statistical facts.
It appears also that much of the trading may have been insider selling and certainly unusual enough to eventually trigger a sale.
Our sell signal was given last night, and the only good news is that GDS opened today at $27.36, up from yesterdays close at $21.83. For odds makers out there, a bounce most often happens after extreme moves.
On the other hand, earlier this month we sold another of our Prime 5 stocks permanently because the news had announced a takeover bid of $137.00 for FMI. After a previous close of $106.45, FMI immediately moved up for an increase of over 28%.
So, the news is going to continue giving us unpredicted surprises in both directions and 2 surprises out of our Prime 5 group will probably never happen again.
This is precisely the reason why we recommend followers to invest their funds in at least 3 assets and a minimum of 5 assets if possible. This way, with the returns from our algorithms, a 28% loss in a surprise attack would be limited to less than 10% of 3 investments or 6% of 5 investments. Obviously, upside takeover surprises will always counter-balance losses.
Fortunately, there seems to be more takeovers than there are fraud announcements and the statistics listed on our charts far outpace these occasional news items.
This is a good place to emphasize the nature of our selected groups.
Our basic selection of Investment Managers represents 10 ETFs that reflect these major professional portfolios and would represent the least risk.
Pairs Trading using none-leveraged inverse ETFs that also reflect the above professionally selected ranges of assets are the next safest risk group and we plan on making these available this month.
Pairs Trading using leveraged inverse ETFs would generally be like the previous group but will have more volatility due to daily management costs that create the daily 3x leverage of each ETF.
From here, we go one-sided in the groups and are therefore relying on the algorithms to be in cash when negative directions are signaled. Here, it should be noted that our algorithms specifically look at potential direction for tomorrow and have demonstrated their ability to participate in upward trending moves.
The current Premier Group only participates in the bullish side of the leveraged Pairs group and goes to cash during downside moves.
The Nasdaq group and the Prime 5 group both potentially have the greatest risk but also have the greatest potential reward. They both only participate in the bullish upward side of stocks or ETFs.
However, the Nasdaq selection which includes the Dow and S&P stocks is created from thousands of assets that have back-tested very well with our algorithms. They are also over 4 years old in their current iteration.
They have demonstrated at least one year of exceptional results compared to their competition and the Prime 5 represents the best of the best from our various selections.
Whichever group you personally prefer, our algorithms will always make their decisions as to which direction they will go tomorrow.
If you review the actual back-tested historical graphs and charts displayed on our website pages, you will see the proof of the algorithms doing their job.
Generally, you will see that they improve the performance of traded market assets by 150% at the low end to over 300% on the high end.
When you add the Professional nature of our selected assets, on top of the leverage minus costs of some ETFs, these improved percentages are the result of good selection, good ETF management and strong mathematical and back-tested algorithms.
Old or New Pairs Trading.
Question � Why inverse ETFs? An explanation of how Pairs Trading has progressed. The popular method before ETFs was to find 2 assets that could be seen to follow each other very closely in the same general direction.
A continuous chart would show them to move apart and back together again in a series of moves over periods of time.
A major requirement is that the 2 assets are available through your Stock Broker to be sold short. This involves your Broker having these stocks available from another of his clients.
You can then borrow the stock through your Broker and sell them on the open market but while the stock is loaned to you, all costs and Dividends payable to the original owner, are personally assumed by you.
Now back to the chart; when the 2 assets are apart, the weaker asset would be purchased, and the stronger asset would be sold short as described above.
As the 2 assets move back together, the combined changes in value will amount to a profit and you simultaneously close both positions. The borrowed stock is then returned to the original owner.
Variations of this method can be conservative low-risk trades or speculative high-risk trades.
With the rise in popularity of ETFs, a more recent method of Pairs Trading is possible. Some Exchange Traded Funds are designed by Producers to move in similar directions and can involve the previous method of trading. For example, 2 different Producers could design different ETFs that contain assets that tend to move in the same direction.
Alternatively, with the use of Call and Put Options and/or short selling, these producers can create ETFs that move in opposite directions. They can also leverage their ETFs to move faster than an underlying asset such as the Dow 30 Industrial Average. To complete a pair of ETFs, they can produce a similar asset that moves in exactly the opposite direction to the Dow 30 Industrial Average.
Unlike Mutual Funds, these producers create ETFs to meet most requirements and are rapidly growing in subjects and types.
Normally, when created to act like a Mutual Fund, such as owning all 30 of the Dow Jones stocks, the management fees are lower than their predecessor Mutual Funds.
However, when leverage or direction is involved, they must be recalculated every day after the market close, to re-establish their underlying commitment and value, ready for the opening of the next trading day.
This calculation and modification every day can be expensive. Due to the use of options, which can gain or lose value very quickly due to perceived value or due to time constraints, expenses mount rapidly.
Our method of Pairs Trading involves our exclusive short-term algorithms that calculate the potential change in direction of a stock or ETF for the next trading day.
We select a pair of ETFs that are produced to move in precise opposite directions based on their underlying design and commitment.
We simply buy the upward or bullish ETF and continue to hold it until the algorithm tells us to sell. We then buy the inverse ETF with the proceeds of the sale and continue to hold it until the algorithm tells us to sell. Continuing this process, we then buy the original position back and hold it again with the proceeds from the previous sale.
Simply put, this pair of ETFs are produced and geared to move in opposite directions. We use our algorithms to switch sides and continue to hold each side as it moves in the upward direction.
We start with a fixed amount of cash and re-invest the proceeds every time we switch sides. All sell and buy orders are placed with our Broker for the next market open.
Trade signals are received by our Subscribers every evening before the next trading day open.
Shortage of Inverse Correlation.
With all the Exchange Traded Funds available today, there is a shortage of ETFs that are inversely correlated to professional Investment Manager selections.
These needed selections are entirely made up to provide none-leveraged ETFs that trade up when the markets trade down.
They must have excellent inverse correlation to the Investment Manager selections that we originally research, and one excellent ETF is named the Proshares Short S&P 500 with the trading symbol SH.
SH trades about 3 million shares every day and is inversely correlated to many of the bullish ETFs and funds at -90% and many of them closer to -100%.
My reason for bringing this to attention is that it would be the preferred opposite in a pair to several of our bullish ETFs and we will most likely use it in several pairings at the same time.
For example, it could be paired with IWD at -97% inverse correlation and also paired with XLI at -90% inverse correlation. In this case, it would become a buy at the same time for both pairs, and we would need to buy twice as many shares as we would normaly buy if it were paired only once.
In the same way, if it were paired with 3 bullish ETFs, we would need to buy three times as many shares and so on.
Once again, this would only become necessary in order to maintain the highest inverse correlation, and there is a limit to the availability of these inverse ETFs when none-leveraged positions are traded.
There are many more alternatives in the leveraged ETF pairings and this may be due to supply and demand. We usually want to maintain as close to a negative 100% correlation to aim for the highest potential profit.
August Changes and Re-arrangement.
With frothy markets and the likelihood for continuing volatility, we are re-arranging our groups to allow for a better mix of selections.
As before, our research into Investment Manager portfolios is playing a large part in our groups and individual asset choices.
Secondly, our algorithms for ETF Pairs groups are expanding to continue the provision for upward leverage as well as safety when reversals occur.
Pairs trading with virtually 100% inverse ETFs is made possible by the creation of these specialized and high-volume Exchange Traded Funds.
With our algorithms signaling changes in direction for each individual ETF, we can enhance the returns with both none-leveraged and with highly-leveraged assets as well as with stocks.
We will maintain coverage of the Nasdaq stocks but will return to a selection of 10 stocks in this group.
While our algorithms signal a change in direction, we recognize that few people like to take advantage of short-selling stocks and many brokerage houses do not offer this service. Often, the stock is not available for short-selling whenever needed to all traders.
The August selections will be available for all Followers and Subscribers after Friday 3 August. This reset is more of a re-arrangement and most of the ETFs will be familiar as well as the top 10 Nasdaq stocks.
How Many Trades per Year.
We have an unofficial statistic that we look at for the number of trades during the previous year of back-testing and the number is 35 buys and 35 sells.
There is one stock that is constantly breaking this rule lately with the symbol SRPT - Sarepta Therapeutics, one of our Nasdaq stocks.
It has been doing well but had a sharp rise on June 19 and has trended down since then almost back to the 50-day average. It is well above our 35-trade number now but unlike FMI, is not subject to a takeover bid.
We will be modifying our selections slightly in August but have not yet finalized them.
We always stick with the algorithms unless a takeover or unusual fact comes to light and we see no reason to invent too many rules to override them.
Our 35-review number is something we have recognized over the years that certainly creates a lot of trades but sometimes has shown to be profitable. Now that I have mentioned it, I don�t have anything more interesting to say about it, but it is a part of our process.
The Nasdaq group went back to number 3 today with the Pairs holding on at number 2.
Always Looking for Indicators.
The adjacent chart 1TPC showed some strength for the S&P 500 Index today.
If you count the position relative to all 50 assets on the chart, yesterday the S&P 500 arrow was in position 15 from the left and today it is in position 18. A more than usual shift.
I did see the strong move for the Index and am always looking for unusual blips. Perhaps it tells us something or not but yesterday I was further explaining some of our statistics and old habits die hard.
I also noticed that the Nasdaq took back its position 2 in the performance chart 1X and the Pairs group went back to position 3.
Small changes but we did see the poor performance of Nasdaq stocks yesterday and maybe this is a correction back to normal or maybe the strength in both signifies further moves to the upside.
I like to strictly follow the algorithms but with the S&P Index now up 6.2% since March 5, we are seeing indications of some strength.
Even the Investment Manager group is seeing strength up to 8.8% now with annual profit around 23% after using our algorithms.
Nasdaq Took a Beating Today.
Sometimes I get ahead of myself in explaining some of the numbers we generate, and I am happy to provide better explanations.
What is the 55% on the UP chart today? We count all the trades in every group since March 5, and today I am looking at a total of 454 individual trades.
Next, we count how many of those 454 trades were up by the time the market closed on that first day that we signaled subscribers to buy them.
For that number today, I am looking at a quantity of 248.
As of this writing, 248 is 54.6% of 454 and we round it off to 55%. Over the weeks and months this percentage will change slightly but it remains as a positive long-range number.
Note that it changes throughout the day because we generally have about 30 open positions and a few of those were opened each day.
Now, this is important. As we recalculate all the algorithms every night, we will also have 55% tomorrow and the next day and the next day and so on.
It is a continuing positive statistic and compounds the results over time. The past average return of those first day correct decisions is up 2.1% today.
The second day and third day and so on, will not match this first day statistic, but it demonstrates that the algorithms are making the correct decisions over time.
Another chart called WIN tells us that today, looking back at all the trades since the same date of March 5, an average of 69% of them made a profit and therefore 31% made a loss or made nothing.
Once again, this chart tells us that the algorithms are continuing to make the correct decisions in the long run and that out of every 100 signals, 69 of them end up making a profit.
More Data Supports First Signal Day.
Now it also tells you the average profit made on that first day and supports our instruction to Buy or Sell on the first day you see a signal.
The group first day performance remains at 56% of them being profitable and the amount of profit ranges from almost 1% to almost 3% per this chart today.
We explained previously that the 56% move up repeats each following day and supports the continuous day-by-day nature of our algorithms.
The first day profit does not continuously repeat but a previous chart named WIN tells us that each first day signal goes on to produce profits about 70% of the time. Losses are produced about 30% of the time.
We have been asked to add the current profit for all open positions and we are planning to introduce this by the end of this week to the subscriber email each evening.
Profit UP on the First Signal Day.
This new Chart named UP, keeps a leger on the performance of our algorithms on the day they give a signal to Buy.
As you can see, the 5 groups are listed, and they are made up from all the different ETFs or stocks that we have used just since March 5, 2018.
A total of 443 Buy signals have been given since then and 247 of those signals made a profit on the first day that they were bought. This represents 56% and is the reason that we urge followers to accept signals on the first day that they are issued.
We do not wait to establish trends before giving signals as the algorithms are geared to look at tomorrow and what will happen then. I sometimes wish that there were no weekends or closed Markets with news that can interfere with the outcome.
Tomorrow the algorithms re-calculate and take another look at the next day. The same statistics then apply, and they will again make a profit 56% of the time.
I suppose it is like betting red or black in a casino. If we continue to win an average of 56% of the time and buy back the position with the money from the previous sale, we have a winning streak going. In the casino, we call this money management.
That really explains what we are doing. By putting the odds in our favor and selecting assets generally picked by the experts, we are fishing where the fish are.
Equally, by inverse Pairs trading, we have a willingness to invest in either direction.
Today�s Top 5 Results.
We have all kinds of statistics about our algorithms and their performance and perhaps you should see which ETFs or stocks lead today. See Chart TOP5.
This selection contains 4 Nasdaq stocks and 1 ETF and together they have produced 85% profit since March 5, which equates to 228% annual profit.
I am encouraged that our previous July Prime 5 selection as described on Chart 1X, has the same results with 85% current and 228% annual profits even though the selection is different. Continuity of statistics is important.
I am mathematically driven and so are my algorithms. I have been crunching numbers all my life and enjoy doing it. This is a condition or a disease.
We are constantly aware of numbers and the shapes that they produce. We can always learn something from a lot of data and it educates us about the present moment but can also educate our future.
For example, I have concerns that the Nasdaq high flyers are doing way better than the leveraged inversely traded Pairs. Logically, it is saying we are speculating with those future tax benefits and I look at this un-paid-for huge tax cut and reason that is where those profits will come from for a year or two.
We hear that investors always talk of bullish markets climbing a wall of fear and that is certainly present on the 6:00 o�clock news. We also hear them say - take what the market gives you.
I think that is what we are doing now. We should be well positioned with those inverse Pairs trades, if or when these markets turn down. I always find it difficult to be constantly expecting profits because the fear seems to shout louder.
I have often referred to the reasons why I like to base my stock picking on those professional Investment Managers. They have bigger and better computers than me and they can study minutia that I cannot.
Corrected Graph Percentages.
I regret some recent errors on the graphs, but they are now corrected. When we started these graphs and began publishing charts on March 5, 2018, we calculated profit as a percent of invested cash. We did this due to each group using cash differently.
For example, the Inv. Manager group began with our standard $2,000 for each ETF for a total of $20,000 maximum.
Due to the different start dates and signals from the various algorithms plus the profits as we progress, this group still has not invested the maximum.
On the other hand, the Pairs group has 20 ETFs, but we usually are only in one side of each pair. So, we still used the standard $2,000 for 10 expected positions, even though we are switching sides from bullish to bearish with each algorithm signal. In this case also we have not quite reached our maximum investment.
The Nasdaq group changed from the previous 10 stocks to 20 stocks in July. At $2,000 each with the new maximum investment of $40,000 for the group, we still have not reached that maximum either.
The same situation exists with the Premier group and with 10 ETFs, they have not reached the maximum of $20,000 today.
The group reaching the maximum is the Prime 5, which at $2,000 for each of 5 stocks or ETFs, reached the maximum of $10,000 quite quickly.
When the Markets turn or stay positive for a week or two, we expect to be at or close to the maximum original investments for each group. When this occurs, comparisons between groups will be even more interesting as we will keep everything going with the same original capital.
Nasdaq Group Continue Up.
Even though we are operating without FMI in the group due to the takeover bid, our Nasdaq group is holding on to second place on Chart 1X.
As this group includes stocks that are growing fast, it tells the story of hope for the future and the confidence of investors to invest there.
I like to read the future in these terms even though I invest strictly based on the algorithms but maybe they represent that same future if I look at my recent comments.
The Investment Manager group gives the story of where the smart money in large portfolios is going and I have commented recently with the PAIRS chart showing the opposite directions for stocks and bonds.
The Pairs group recently had fewer positions, but they were all on the bullish side. Fewer positions tells us that more positions are on the cusp and are struggling to decide which direction they prefer.
The Nasdaq group is the only group we have of individual stocks even though they are all high growth and their risk level is higher than the previous examples.
The Premier group has high individual risk as they are just the bullish side of our Pairs group and they are all leveraged ETFs. Some of that risk is negated by the bond and gold pairs and to a small degree, the oil services but that assumes they are included in a portfolio selection of pairs.
The Prime 5 group is strictly a measure of where we recently made high profits and is in the expectation of that trend continuing.
We are working on ideas to offer the performance and leverage along with the wisdom of the professional portfolio managers to further round out our selections.
Better to Watch the Graph Slopes.
Once again, a look at the Pairs group at the close today. If you watch the Markets, you must also watch the News.
At these times, my first look is at the graphs for each of the groups on their various Booster pages and they continue to show predominant upward slopes.
It always helps to look first at the professional Investment Manager group where you would see a reflection of their efforts. Bumpy as it is, they are the basis of our stock and ETF picking but more than any group, they must look around the world for information.
I added the Pairs chart to show that all the Pairs bears were up once again except for the Financials this time which were bullish. We continue our algorithms without modification where Followers have seen performance in both Market directions over the past three-year period.
Our selections cover US Treasury Bonds all the way to Emerging Markets and many investment opportunities in between.
We are seeing an increase in daily trades from our back-testing of the fixed income ETFs, TMF and TMV. This compares with all other ETFs that we follow and can be interpreted as greater activity towards or away from safety. Increasing interest rates lean towards the former.
However, all graphs continue their upward general trend. We did remove FMI from the Prime 5 group due to the takeover price jump. This action reduced us to Prime 4 for the balance of this month. It also stands to reason that the Nasdaq group might well be a prime indicator of a future change in direction.
Another supporting result over the weekend was although the total number of Pairs showing a buy signal was down to 5, they were all on the bullish side.
Our Algorithms are 70% Winners!
This WIN chart shows you our batting average since we started giving you daily predictions the day before we made each trade since March 5, 2018.
It currently represents over 400 trades in more than 50 different assets and has produced an average profit of 42%, which equals an annual profit of 117%.
If you like them, please read on.
Our profit is also detailed on chart 1x which is usually published every evening along with the Blog.
I have sometimes referred to our algorithms being 60% to 65% accurate in their decision making and I am pleased to have enough solid pre-published evidence to back up my statements.
I do want to explain some facts. The Prime 5 group has the highest performance but also has the least trades. Obviously, these are selected each month and it is not surprising because they are generally expected to be going in the right direction.
On the other hand, the Investment Manager group has the lowest WIN percentage but represents a rounded portfolio selection of conservative investments.
My advice is to seek your own preferred investment style and find that match within the 70% average at the bottom of this WIN chart as some of these assets are included in more than a single group. All groups have exceptional short-term as well as long-term profits.
Each one of these trades started with an available investment of $2,000 on March 5 and has produced a total profit of over $41,000 since then. Our brokerage fees at $3.49 per trade amount to less than $1,500.
By March 5 of 2019, we expect to have $216,000 from our gradually invested $100,000 and the reason I say excess, is that these results have been obtained while the S&P 500 Index has gone up just 4.5%.
I always enjoy questions from our - Contact Us � webpage. We are excited now at this 7-year project with 3 years of publication behind us and we offer 47 years of previously proven Customer Service and reliability.
What to do with 2 BUYS.
So, the question arises: if you are looking at any Pair of ETFs, and you already own one of the pair due to a previous buy signal, what do you do if you get another buy signal for the second ETF.
If you have sufficient cash available or you have a margin account, you buy the second ETF, because the cost of ownership for a few days is insignificant.
The main reason to buy is that both algorithms are close to a decision point and the odds favor the side that is making the most profit for you.
In the long run, this will be the best strategy and the calculations that you could do are not worth worrying about.
The most likely concern is if you do not have sufficient cash available in your account and you do not have a margin account, such as an IRA or other pension account, you may run into the T+2 Banking Rule.
You could decide that it is better to sell the side that you already own. This action will use up one of the two days of the Banking rule to increase your settled cash one day sooner.
This really gets into the calculation weeds beyond this point, but I have had these warnings in my own IRA account and sometimes the algorithm signals come fast enough to be almost unfathomable.
The rule is you can buy a stock with the proceeds from a sale, but you cannot sell that new stock until the original funds that you used to buy it, have settled into cash in your account.
This drives me crazy. The Broker software could easily warn us ahead of time, but their software only helps them to give you the message after it is too late. Why not go the extra mile to help us avoid the warning? Some Brokers may do this.
That is most likely the price we pay for taking advantage of low Brokerage fees.
A Demonstration of Pairs.
At about 11:30 this morning I was checking the Markets and saw a great demonstration of why I like Pairs Trading as a system for all seasons.
Look at the attached screenshot of our 10 pairs at that time. The Markets were down about 0.05% and just look at the 10 bullish ETFs and the 10 bears.
I just want to show how you will make money when the Markets decide to go in a sustained opposite direction.
We will have just as many bears when that happens as we have bulls today.
Alternatively, you can sell short-stock or perhaps trade the mis-alignment of correlated stocks. You could also sell covered calls against your stock and minimize your losses, or you could throw the Hail Mary and buy some puts.
Notice that the Bond TMF was going in the opposite direction at 11:30 this morning, so you could also sell all the stocks and move into bonds hoping for a substantial change in direction.
Of course, you need to know the direction of the Markets for these to work well for you and we all know that is not an easy decision.
That is why professional Investment Managers try to have a piece of every pie and make a moderate return on a more sustained basis for their clients.
This is also the reason why we keep an eye on what the professionals own for our Investment Manager Group which is aimed at conservative followers.
But take another look at the screenshot. If you have a method (an algorithm) for generally getting the correct short-term direction, it makes a lot of sense to trade inversely correlated ETFs.
The more inverse the better, assuming you can overcome the management costs of creating these 100% inverse and leveraged ETFs.
Eliminating a Nasdaq Stock - FMI.
A proposed buy-out of FMI has caused the stock to trade around the offer price and any future gains are questionable. We will eliminate it from our Nasdaq list today by putting a SELL on the stock and will replace it next month.
We are approaching the point at which our � Profit since March 5 � chart 1TPC may have to be changed to a more recent date.
This is one of those decisions that has no perfect answer and we continually check the statistics to find the best date to use for best performance. We used the date of March 5, 2018 because that was the first date in the past 3 years that we offered these group selections.
From Chart 1X, our average profit from March 5, on all 50 positions is 43% giving us an annual profit from all 50 of 123% and a best annual profit of 257% from the Prime 5 group. All our trade positions were published to followers on the day before the trade was made.
My preferred group is the ETF Pairs group at 118% annual return, simply because of the minimized risk factor. I think this is a perfect selection for IRA and longer-term accounts.
I always use the � Rule of 72s � which tells you if you divide 72 by your annual interest rate, it gives you a projection of how many years it will take to double in value. This method tells you that 72 divided by 118% would double in value every 7 to 8 months. A worthwhile goal for everyone including me!
Hello UK � Hello Hong Kong.
I was born in Coventry, England and my wife in Hong Kong but that has nothing to do with how pleased we are to have many followers in both countries. Our website lights up every day from both places.
Knowing that UK residents have 0.5% tax to pay on trades, I am not sure if overseas trading can eliminate that. Fortunately, we have interested followers around the world and I am very pleased to see them.
I think it is more to do with internet reach and the ability to trade from wherever we happen to live.
I am also a Mexican Immigrant as I first migrated to Mexico City from England in 1963 for Bristol Aeroplane Company, after applying for Citizenship, and eventually migrated a second time to the USA after another job offer.
Changing the subject again, one of our Company accounts is with Interactive Brokers and they are well represented in many countries. They also have very low brokerage fees here in the US, but I believe they are higher in other countries.
I recently tested RobinHood.com, who advertises free trading, but I found that they did not trade American Depository Receipts and decided not to proceed with them. However, anything FREE is good.
PUMP UP your PROFITS - FOLLOW ME.
We have demonstrated two important facts and if you have followed us, you know how this has performed in the past.
The first is that our Algorithms provide easy signals to follow.
The second is signals perform well in the short-term, mid-term and long-term.
So, pumping up profits is demonstrated with our Prime 5 Group of 5 top performing ETFs. Now, we will show you how we do it with Pairs Trading.
First, look at our Rank Chart above and then decide how much of your money you want to apply to this method.
To keep this simple, I am going to assume for now that we will use $10,000 and all 10 of our pairs in this example. We will show some further examples later.
Make a 7-column chart and enter the 20 Pairs symbols and current prices in the first 2 columns.
From my Rank Chart, enter the Recent Daily Profit which is currently calculated for approximately 90 days, next to each ETF or add current values from the last column of the daily SUB Chart if you are a Customer.
Add Pairs together to give combined Profit and add to Combo Profit.
In the 5th column, calculate the Account Percent by dividing each Combo Profit by the total profit at the bottom of column 3. This tells you what percentage of the $10,000 you should assign to each Pair.
In the 6th column, rank the highest results of column 5 from 1 to 10.
In the Account Value column, multiply your Account Value (say $10,000) by the Account Percent value.
You now have your total investment value for each Pair based on recent profits. Divide this amount by the Price per Share to give a BUY quantity.
When you eventually SELL these shares, put that amount into the Value column and use that same amount to make a BUY when the next signal comes.
If you really want to PUMP UP your account, you could limit your Account Value to just the top 5 RANKED ETFs. This Chart can easily be set up on an Excel spread sheet and updated automatically.
Another tip is to make your account into a Margin Account which eliminates the T+2 Banking Rule when buys and sells come in rapid succession.
Note that occasionally we get a situation where both ETFs of a Pair have the same signal to buy or sell. This happens because the algorithms operate individually, and the signals are trying to make the right decision. When that happens, and you get the second buy signal, you could decide to stay out of both sides until only one of them has a buy signal. There is little to be gained either way, but we wanted to explain it.
Our Look at Professional Investment Manager Portfolios.
(Note - Nasdaq chart is corrected to include 20 stocks instead of 10 at $2,000 each.)
It may be helpful to see the results of our research during June. The following chart gives you numerical results, but we also got some comments that we would like to pass along.
The tax cut is seen as a reason for earnings growth to continue through 2020 and mid-sized companies seem to get most of those votes.
Large companies are using the opportunity to buy back their shares and individuals in the general population are not seeing their expected wage growth.
We have reflected our findings into our Inv. Manager Group by using the ETFs that they own. We have also followed through with similar offerings in our Pairs Group. It should be noted that there is little change since the previous results in May.
Pairs are not as critical to world popularity due to our method of trading them. We also try to include strong movers where available. Some are closely correlated but this is mainly due to accounts of investment managers having 65% invested in Total US Stocks from Small Cap to Large Cap.
The Nasdaq stands alone as a collection of current top performers but obviously, due to their growth prospects, they do fit into currently popular trends.
I am also very conscious of the needs of conservative investors who prefer to follow a solid investment theory that matches our Inv. Manager Group. With that in mind, we are looking at a future change that will move the Nasdaq Group back to their top 10 rather than the current 20.
We would then offer a more conservative Pairs Group that takes advantage of the Inv. Manager Group, but also offers equal and opposite ETFs that could return an annual yield in the 40% to 60% range.
Pairs Trading the Roebuck Systems Way.
The old way of Pairs Trading used to involve 2 stocks that generally traded in a similar well correlated way except that the distance between them would expand and contract over time.
The trick was to trade that difference by buying one and short-selling the other when the distance between them expanded. The position could then be closed when the 2 assets traded back together again.
It is like watching paint dry but can be low risk and profitable. However, we have a much better way with ETFs.
Our algorithms trade equally well in both directions and with all the new and leveraged ETFs available, we can choose a Pair that are correlated to move in the exact opposite direction.
By using our algorithms, we don�t need to wait for them to trade apart or trade back together again. We simply trade them almost 100% of the time in either direction according to the algorithms and short-selling is not required.
We also select Pairs that are triple-leveraged to gain the maximum movement and profit from each trade.
Our algorithms are perfectly tuned to work with ETFs that move 100% in opposite directions because they specifically work to detect a change in direction for tomorrow.
You will find a complete selection of high volume ETFs on our website and the signals when to buy and sell either side of the pair is sent to you each evening.
Try it, you will like it. . . !
How to Make YOUR Decision.
What type of investor are you? Here I try to give you guidance on making your decision based on the information and signals that we send to you each day.
Rule 1 for BEST results. BUY or SELL at the next Market Open after we send a signal change.
Rule 2 for SAFE results. BUY or SELL on any other day that you see a signal.
Rule 3 for GOOD PRACTICE results. BUY at least 3 to 5 positions and limit yourself to 11 positions, unless you want or need extreme diversification.
Before going to rule 4, I need to point out that all the following back-tested numbers are for 1 year and the current actual results are since March 5, 2018 when the S&P 500 Index has produced a return of 1.2%.
I will add that I have been publishing these algorithms for more than 3 years and the only thing that beat them was Credit Suisse removing their ETF Volatility symbol XIV from the marketplace overnight.
Rule 4 requires YOUR JUDGEMENT. Some of us can make aggressive risks and others do not choose to take those risks. We offer different levels to suit everyone.
The least risk is the method we use to make our initial selections. Each month, we research what professional investment managers are currently owning and try to match our Investment Manager Group to their portfolios.
We select unleveraged ETFs that best correlate to their professional choices and produce our portfolio of 10 Investment Manager selections. Our current back-tested algorithms improve our Investment Manager group by about 358% to produce a relatively safe annual return of 19%.
The highest risk is probably the method we use to select our Prime 5 Group. From all the algorithms that we run and publish every day, we currently take the profits of the 5 best performers since March 5, 2018 up until the end of the previous month and put them in the Prime 5 Group each month. Our current back-tested algorithms improve this Prime 5 group by about 157% to produce an annual return of 244% assuming similar Market conditions.
We have 3 other groups that may fit your needs better than those described above.
One of these is our Nasdaq Group of 20 top performing Stocks. Minor changes to this group occur each month. Our current back-tested algorithms improve this Nasdaq group by about 143% to produce an annual return of 122%.
Here, you should look at all the back-test charts on our website for all selections and notice how well we manage to stay with the uptrends and get out of the downtrends.
The second of these groups is our newer ETF Pairs Group of 20 leveraged ETFs. This group consists of 10 pairs of ETFs that broadly correlate to the Investment Manager sectors. Each pair trades inversely to its partner and operates uniquely. Consequently, they are jointly in the market about 100% of the time but move in opposite directions. Occasionally they are both in or out of the Market, creating an approximately neutral position. Our current back-tested algorithms improve this ETF Pairs Group substantially to produce an annual return of 109%.
It is worth mentioning here, that our algorithms work equally well in both directions with ETFs and stocks and this type of pairs trading with 3x leveraged ETFs removes downside risk substantially. It also overcomes the large daily management costs associated with providing the leverage.
Our final Premier Group consists of the 10 bullish ETFs from the above Pairs Group and therefore does not trade the Market reversals. Our current back-tested algorithms improve this Premier Group by about 413% to produce an annual return of 89%.
Personally, when I was younger, I would have chosen the Prime 5 Group, with the hope of large profits and great results. Today, I choose the ETF Pairs Group, knowing that it is relatively safe and low risk. One thing that will hurt me is flat motionless Markets and I am not planning on that today. This paragraph is my opinion and not my advice.
We Hope July Changes Went Smoothly.
This was a larger change than we like to do at month-end, but the potential profits will be higher with the changes.
The S&P 500 includes all the Dow 30 stocks and the Nasdaq includes about 90 of the S&P 500 stocks.
Our Algorithms work equally well on all stocks and ETFs, so it makes sense to go with the maximum profit potential and expand the Nasdaq list to cover a wider range for interested Followers.
You can choose your own selections or potentially use the SUB chart to help.
Subscribers can see the SUB chart each evening where the last column gives historical - Daily % Gains - from the Algorithms and could be used to help make your selections.
Concentrating on top performing Nasdaq stocks, gave us the space to expand the Pairs Trading selections. Trading in both directions with maximum leverage gives you maximum potential with the least risk and fulfills the interest of many current investors.
Conservative investors will still like our Professional Investment Manager group which remains a correlated group of ETFs matching professional selections and we have included all aspects of their portfolios in our selections of Pairs.
This includes fixed income as well as ETFs that represent different world Markets and sectors.
Only ETFs give us easy access to trade in both directions.
However, the individual performance charts on the website are worth reviewing to see how well our Algorithms stay with a profitable trend and get out when circumstances indicate a reversal.
This works well for Nasdaq stocks. However, it gives us the ability to profit by trading the reverse direction as well by using inverse ETFs.
Improved July Changes.
We find no changes in our underlying Professional Manager Portfolio of 10 ETFs and it remains the same for July.
As you may recall, the S&P 500 Group swallowed up our initial Dow Selection. The same has now occurred to our S&P 500 Group just like the Dow Group and there will now only be one expanded and combined Nasdaq Stock Group of 20 top performing stocks.
Our other popular Pairs Trading Group is also being expanded to include 20 ETFs or 10 Pairs that reflect different sectors of the Professional Manager Portfolio.
In theory, by following and correlating with Professional Manager Portfolios, the least long-term risk would be with these unleveraged ETFs. Long-term results from these tend to be in the 9% to 13% annual return. However, we expect our algorithms to provide approximately a 250% to 300% gain on those professional portfolios, based on over 3 years of results and more years of back-tests.
The best performers are generally the Nasdaq and Pairs Groups and that is why we have expanded them. The Nasdaq selections can have some spectacular results especially with the gains that our algorithms add to their normal Market performance.
For those investors that follow Pairs Trading, this can be the most rewarding because our algorithms perform with 3x leveraged ETFs in both directions. Using ETFs that are uniquely designed to operate in exactly opposite directions, they quickly recognize the best direction to follow.
Normal maintenance costs for the 3x leveraged ETFs can be considerable but these are easily overcome by the gains from our algorithms.
The Bullish side of our Pairs Trading selections now becomes our Premier Group of 10 ETFs.
Finally, our Prime 5 Group consists of the best 5 previous month-end performers.
Nasdaq Gives Way to Pairs.
We have seen a dramatic change in recent days between the Nasdaq group and the Pairs group.
Exactly as expected, the Pairs group has taken advantage of the opportunity to trade in the opposite direction and seems like it just kept going.
On the other hand, the Nasdaq has been taking a break along with the other single direction groups. This is where you can see the danger of trading 3x leveraged ETFs with the wide swings they can make in a few days.
The safety position in single direction groups is first of all related to the professional portfolios that we research and follow.
This is amplified by our Algorithms that are just as capable on the downside as they are on the upside and will tend to get out of positions quickly.
Finally, it is good to look at the S&P Index compared to our average results and we remain up about 20% while the Index struggles at 1.3%.
How Far Does an ETF Move?
Some interesting comparisons can be seen if you add the day-to-day price changes for each asset for one full year and then divide the accumulated change by the average price.
For example, our Investment Manager selections move about 160% of their average price. They are conservative high-volume assets with less risk.
Next are our S&P stocks at 417% and then our Premier ETFs at 435%. The Nasdaq selection is at 705% but the winners are the Pairs Trading at 800%.
Why do we care about these numbers? Because our Algorithms are based on Mathematics and numbers always seem to reach expected results.
The first result you may notice is that the two selections that tend to rank the highest are the Nasdaq and Pairs Trading groups. Not surprising, since they move the most and the opportunity to clip profits from those moves is higher.
Alternatively, the lowest movers are the Investment Manager selections which correlate to huge portfolios of professionally managed wealth around the world. So much wealth that it moves more slowly but also has less risk.
Then comes the Nasdaq with all the up-coming businesses and ideas that investors pay higher prices for, with the expectations of making that fast dollar.
Finally, we get to the winners with so much movement to clip those profits.
If we could make these into a conservative investment, could we have the best of both worlds? The answer is YES.
We do it by alternatively investing in both directions in ETFs, that by themselves are very risky assets, but we change horses when we see a change in direction.
Obviously, the 3x leveraged ETFs are the risky end of the spectrum, but by changing direction reasonably well, using our Algorithms, we get to ride the faster horses much longer.
Pairs Trading Becomes the Advantage.
Further to our Blog yesterday, the 100-year long-term Markets are going up and we addressed this situation by using professional Investment Managers.
We have often remarked that our Algorithms are solely geared to tell us what the stock or ETF is going to do tomorrow only. Not the day after that. Their daily prediction is correct over 55% of the time.
Pairs Trading then takes care of in-between trend changes and you will like our July selections and here is why.
If the Markets begin a short-term trend of more than one day in the opposite direction, they will soon change their signals to the opposite direction. This can be from a Buy to a Sell or a Sell to a Buy.
In the old days and I mean more than 5 or 10 years ago, when the Markets turned down, you would have to sell borrowed stock in a short-sale, or perhaps get involved with the Options Markets. Not anymore.
ETFs have solved this problem by producing INVERSE assets that immediately go in the opposite direction, so when our Algorithms begin signaling a Sell, we can simply sell our existing position and buy these Inverse products. No more short-sales.
Now there are some limitations that we need to consider.
Leveraged ETFs lose value daily due to the daily maintenance and management of retaining the leverage. They use options to create the leverage which lose time value as they approach their expiration date and strike price.
The other result of having this leverage is the speed at which they can change value and hence, have added risk.
The 200-Day Moving Average.
Once again, we went down through the 200-day moving average and are close to the 50-week moving average.
I mention this because I used to watch all this technical stuff all the time and it became the reason why I developed Algorithms nearly 8 years ago. Will we bounce off it and go back up or will we go through it and look for whatever comes next?
The advantage of algorithmic trading is when you know it works, you follow the signals when issued and go back to whatever you like to do for fun.
We are well over 3 years of publishing signals every evening and have no reason to go back to Technical Analysis again.
Our July versions are almost complete, and we are continuing the concept of letting the professional Investment Managers of worldwide portfolios do the selection for us.
In July we will continue to include our correlated ETF version of these professional portfolios.
We also will include an expanded 10-ETF selection of our 3x leveraged portfolio and have added the 10 most INVERSELY correlated ETFs to create a Pairs Trading selection of 10 Pairs that reflect the professional portfolio.
Plainly speaking, we will have 3 sets of Exchange Traded Funds.
1. A none-leveraged, correlated and balanced set of 10 ETFs matching professional portfolios.
2. A 3x leveraged, correlated and balanced set of 10 bullish ETFs also matching professional portfolios.
3. A 3x leveraged, correlated and balanced set of 10 ETFs that INVERSELY match the professional portfolios. (This creates 10 natural sets of leveraged ETFs for Pairs Trading).
Adding to the above, there will be an expanded selection of 20 Nasdaq stocks which are proving to be the most popular and successful group. The stocks that are also in the S&P lists may appear as a part of the Nasdaq selection.
Finally, we will continue with our Prime 5 selections of ETFs from the entire list.
Where Are the Best Stock Picks?
The answer is in the portfolios of large Professional Investment Managers or on Roebuck Systems website. We research them continuously and choose our selections to correlate with them.
We do it because our Algorithms work on good investments just as well as they work on bad investments.
Conservative Investors can follow our � Investment Manager Boosters - and know they are investing with these professionals in mind rather than some lesser known source. Most of our selections reflect their portfolios.
As a starting point, they may have 70% in stocks or funds and 30% in income producing bonds and they adjust those percentages up or down according to their future expectations.
Their stock portfolio is further adjusted with mixtures of North American, European, Asian and Far Eastern stocks or Emerging Markets. Finer adjustments can be made with specific countries.
Major Industrial Sectors are another way of tuning these portfolios by being specific on Technology, Healthcare, Finance or other major categories.
Bonds and interest rate portfolios are also adjusted to include mixtures of Federal, State, Municipal and Corporate sources as well as short or long-term maturities.
Mutual Funds also allow some fine tuning but ETFs and ETNs, (Exchange Traded Funds or Notes), are relatively new and cheaper ways to create baskets of assets. The huge growth of ETF/ETNs can produce savings from 0.5% to 1.5% or more, depending on the added loads and fees that can be associated with Mutual Funds. This difference produces critical savings to major investors and/or critical income to major producers.
Beyond these critical decisions, there could be smaller specialty investments in precious metals or volatility. There is competition to deal with and every Manager is looking for that extra percentage point over their competition.
So, we research these portfolios and try to accurately correlate our selections of Exchange Traded Products and stocks so that our Followers will be where the smart money is being invested.
We try to follow this concept through all our selections and always look at volume as an important factor.
This Drives Me Crazy.
I had a quick look this morning and since March 5, 2018 the S&P 500 was down over -0.5%.
Our average since March 5, 2018 is up 19%. Again, our AVERAGE is up 19%.
I often wish that I had chosen a different start date for all comparison charts, but it is way too late to change my mind. I wanted to be able to compare everything going forward and this is where we are.
Professional Investment Manager Portfolios are another key factor and are very important to us.
As you recall, we started with our DOW group, S&P 500 group and Nasdaq group along with various ETF selections.
There is no doubt that the Nasdaq selection is earning a permanent place with well over 100% annual returns even in these flat markets and we do not have any plans to eliminate that group.
By checking the various individual asset charts and back-test charts, you can also see that we do a very good job of staying out of down Markets. There are a few that occasionally synchronize with our Algorithms and take a while to detach themselves but overall, the record is good. UGAZ and DGAZ are good examples of this. That is one of the reasons why we suggest following a minimum of 3 assets and a maximum of 11.
ETFs however, offer remarkable results and keying them to professionally selected assets as we do will always be key to our selections.
We research PROFESSIONAL portfolios and CORRELATE with them.
We LEVERAGE and stay with the UP markets and get out of the DOWN Markets quickly.
With ETF Pairs Trading, we also INVEST in the DOWN markets as well as the UP markets.
UGAZ and DGAZ not Performing.
We mentioned the Pairs as being a preferred group in terms of performance, but gas is hurting our results this month and will be removed and replaced in July.
Too many trades lately causing us insufficient time to get into a trend.
Between the two of them there are about 220 trades per year which is way too much switching direction. My advice would be to stay away from gas until it comes into favor again.
We will have some great Pairs replacements for July and more positive changes.
We Begin Looking for July Additions.
Before looking forward to July additions, we should take a look back at which results have been good for us.
Our average Group investment from chart 1Y has been $15,624 with a profit of $3,309 giving us a profit in 106 days of 23% or an annual profit of 77% so far.
All this while the S&P500 has made a 3% profit for an annual profit of 10% for the same 106 days. We have Boosted the general market results nearly 8 times over this same period using 50 different assets.
I like those numbers very much but am always looking for a better way so that everyone who follows us will do better than the average of 77% annual return.
If you were following our lowest group, the same chart shows the professional Investment Manager portfolio would have returned 7% so far with an annual return of 23%. My comments from earlier days suggested that 14% average annual return over a long period for this group would be very good.
If you were following our highest group, ETF Pairs group has produced 38% so far with an annual return of 131%.
This gives you the hint that July may well see some new ideas in the Pairs arena.
Nasdaq Group Remains Popular.
It stands to reason that the faster growth companies are in the Nasdaq range as many of them are newer and growing their operations.
We get to select from this group which also tends to have higher volatility and produces greater returns through our Algorithms.
They persistently stay at the top of our groups and compete well with the Pairs selections for the number one position in back tested returns. This brings to the forefront one of the features of the Algorithms and their annual results.
The net results obtained in our live accounts are a compilation of the underlying asset gains plus the arithmetic gain from the buy and sell trades specified by the algorithm.
If the underlying stock or ETF is doing well by itself, there is less meat on the bone for the algorithms. You can see this in the Chart 1x column under -BACKTEST Potential Gain. Nasdaq gains as a group, are in the range of 137%.
Comparisons with the Pairs group are not appropriately accurate because we switch sides in those trades and that complicates equal comparisons. That being so, we prefer not to attempt to put a value for the Pairs gain even though their performance is very high.
ETF Pairs Trading Decisions.
When we added the ETF Pairs Trading selections, a deciding factor at the time was to include both sides of the pair so that we could publish the entire story.
As we are mostly invested in only 5 ETFs because one of each pair is moving inversely to the other, it seems like a waste of opportunity.
However, we have seen on recent days that we are occasionally in both sides at the same time or alternatively, in neither side at the same time. Either way this puts us in a neutral position, assuming equal cash investments.
This tells you that the algorithm is thinking but not sure of the next move. Perhaps the best decision when you see the second side signaled as a buy is to sell your existing position and be neutral in cash.
If you buy the second position instead and then sell one of them later, you still pay 2 commissions either way, so you are probably better off being neutral in cash.
I would choose that in my IRA account because the T+2 Banking Rule can become a problem if I don�t have the required settled cash for a trade if the next buy will use the balance of my account value.
This is where margin accounts become useful because the cost of using borrowed money for one day is very small and your Broker avoids annoying you with one of those Good Faith Violations.
A margin account avoids all these Banking Rule problems as well as our own 98% rule.
When we are making a final buy to use up our last available capital, we always use 98% of the capital and leave 2% so that overnight price changes will not cause our Broker to cancel a trade at the next open. Paying interest for a day on a small amount is preferable to missing a buy and it avoids doing that 98% calculation.
Investment Managers Portfolios.
We continue to refine our derivative selections from professional Investment Managers because we want our Algorithms to have the best source material to work with.
Having confidence in the underlying funds and ETFs is important when moving from an unleveraged account to one that is highly leveraged like the 3x and Ultra ETF selections that we include.
However, it is also important to look at the back-tested charts for each group to see how we manage to stay away from down markets.
Looking back at these charts as well as following them into the future with us, shows that in most cases we quickly get out and stay out of steep declines.
This is all part of the Algorithm nature to add together most of the up-moves during the year and avoid hanging around during the down slides.
We are also aware of the daily volumes needed to keep the bid/ask spreads as close as we can. Our average trades are currently running at about 17 buys plus 17 sells per year per stock which is less than 3 per month.
Trade on the First Day of a Signal.
Always trade on the following trading day after the first signal change occurs.
Our Algorithms are designed to Buy or Sell on that next Market Open and unless you have some unique knowledge of your own to override the signal, it is strongly recommended that you stay with the signal.
There are lots of flashes of brilliance for you to want to change your mind and some of them on some of the days will make you wish you had. There are always improvements to be had and we are looking for them every day.
As stated, we have been looking for a long time but remember the main advantage was the ability to carry on with a normal activity during the daytime and avoid watching the Markets all day long.
There certainly are other systems that can follow open trading and may signal the exact time for you to make your trade but ours is not designed to do it.
We prefer to look for what the Markets can offer us and then decide which are the best odds that we can find.
Stock prices tend to move around facts that are either positive or negative and are not randomly distributed. They tend to cluster around the same price when there is a lack of information to move them.
Adding or eliminating a stock or ETF from our main crop of 50 opportunities has become a month-long job for us. We take it as an opportunity to adjust the portfolio to the longer-term changes in the daily news cycle.
Why Comparisons Begin March 5, 2018
Although we began working with these Algorithms in 2011, we previously published data for volatility for 3 years, through early 2018 and stopped doing that when Credit Suisse took their inverse ETF, XIV off the market.
We then continued with common stocks and ETFs early in 2018, and we publish results going back 12-months for those that we recommend.
You will find these 12-month charts on the pages of the various Booster groups, along with the current history of all trades beginning on March 5, 2018.
As all signals within the Booster groups did not occur on the same date, we wanted to provide live signals as they occur before the actual trade date. We wanted to start publishing these new signal recommendations to build at least a 12-month record for Subscribers to see them in action.
When we reach one full year, we will then decide how best to proceed.
It is worth repeating that back testing beyond 18 months is of little use to our results even though we have gone back as far as 1990 in some cases.
Live comparisons between the Booster groups are important for Followers and Subscribers to judge the best way to proceed for their own investment decisions.
Different styles and risk levels are available ranging from a conservative Investment Manager portfolio to a leveraged and fully correlated Premier version of the same portfolio.
We also offer Common Stock selections from S&P 500 and from Nasdaq as well as leveraged Pairs Trading recommendations.
NASDAQ Stocks Remain First.
We continue to have great success with the Nasdaq Boosters which are up at 98% annual profit while the S&P 500 Index remains at just 14% annual return. That is a 700% gain on the Index.
You can see from the chart 1Y that the average gain ratio is 5.3 to 1 today or equivalent to 530% gain for all 6 groups of Boosters compared to the S&P Index.
Considering that 20 of these stocks are either from the Nasdaq or S&P 500 and have no leverage, we are getting much better than a 200% gain from our Algorithms even in poor Markets.
Although we are doing well with regular stocks, we will see a larger benefit from the leveraged ETFs when we get a positive direction for our Markets.
Investment Manager Portfolios - Part 3.
2 days ago, we used the current Inv-Manager Boosters result of 14% annual return, which we then boosted to 31% annual return. Continuing with results as of yesterday, our Premier Boosters were at 41% annual return which we then boosted to 105% annual return. These numbers vary slightly each day.
Then we said � If your 70% in an ETF portfolio currently makes 14% annual profit and you take one fifth of it and run it through our Algorithms, your new annual profit jumps up to over 17%. That is (14+14+14+14+31)/5 = 17.4%.
Now, we can move up the leverage ratio ladder. We said that our initial selection comes from professional world-wide Investment Managers. Then, using correlation formulas to maintain better than 95% correlation, we found the 3x leveraged ETF products that best represent the exact same portfolio.
We now have our Premier Boosters which you can find on our website.
Next, we can repeat the calculation for the Premier Boosters. We will also use actual pre-published trades based on 7 years of research and published since March 5, 2018.
Please note that this period has not been good for the Markets and has produced an annual return for the S&P 500 Index of only 3.7%.
Our Premier Booster group has produced 39.3% annual return as seen in the Buy & Hold column whereas the base unit Inv Manager group has produced 13.7% annual return also from the Buy & Hold column. That is a 287% increase (39.3%/13.7% = 287%) and a correlation of almost 96%. (287%/300% = 96%).
Suppose your 70% of your portfolio in ETFs is currently making 39.3% annual profit as published in our Premier Booster Buy & Hold column. Now look at the actual potential annual Algorithm Gain at the bottom of the Premier Booster chart. This group has a gain of 265% and an annual profit of 104.3%.
Finally, look at these results. If you take one fifth of your portfolio and run it through our Premier Booster Algorithms, your new annual profit jumps up to more than 52%. That is (39.3+39.3+39.3+39.3+104.3)/5 = 52.3%.
Once again, suppose you increase the portion through our Algorithms to two fifths of your investment, your new annual return jumps to over 65%. That is (39.3+39.3+39.3+104.3+104.3)/5 = 65.3%.
As previously stated, for each one fifth (20%) of your portfolio you invest in Premier Boosters, your annual profit jumps by one fifth of the difference in the annual return rates; in this case 13%. That is (104.3% - 39.3%) = 65%/5 = 13%.
The point of these Part 1, 2 and 3 explanations are that you start with 14% annual return from the expert Investment Managers and jump to 31%.
Alternatively, in the leveraged and correlated portfolio, you start with 39% return and today you arrive at a potential 104% annual return. This is using expert managers all the way through: -
1- Professional Portfolio Creation
2- Correlation and Leverage and
3- Roebuck Systems Algorithms.
All the above data is taken from actual published results and may vary slightly every day, but it can be verified at any time from actual data. Future results will also vary daily but we will continue to publish our trades on the previous day to all subscribers.
Investment Manager Portfolios - Part 2.
If you read the Blog yesterday, you will better understand where we are going with these added comments today.
Correlation of stocks is a designation used by many investors to find assets that move in a similar pattern.
If you laid the chart of one asset on top of another and they perfectly match each other, you would say they have a 100% correlation.
Correlation used to be a difficult thing to find in stocks.
Perhaps the first attempt at trading opposite directions was switching from Long to Short. Insurance policies, which became known as Options, then gave you the choice of Calls or Puts.
Now we have ETFs with the leverage given to them on a daily re-calculated basis using Options. In theory, when the Markets first open in the morning, they have a leverage factor of 2x or 3x the movement of the base unit and are reshuffled every night after the Markets close, to return to this published leverage value.
So, here we have an ETF, leveraged to go at 3 times the speed and distance of the base unit and reshuffled every night so that it correlates 100% with that same base unit!
Have we arrived in Heaven, or am I missing something?
Here is what we do. We take the Investment Managers professional selections and then use the ETF Managers professional mathematics to find something that has 100% correlation to the base unit and then it triples the movement.
Not finished yet. Now we use Roebuck Systems Algorithms to tell you when to buy and sell the ETF to increase the profits by an average of about 225% for this particular group of assets. What could possibly go wrong?
Our Algorithms look at long-term and short-term factors individually for each different asset and group. They then work to keep you out of the market when it goes down but will keep you in the market when it goes up.
So, if the Investment Manager experts make 13% and the ETF experts multiply the 13% by 3 to make 39% and we then multiply the 39% by 225%, then YOU end up with 88%.
From all of our selections, this one has the least potential but also has the least risk.
Investment Manager Portfolios - Part 1.
Large portfolio Investment Managers are the source that we study and use to provide our Inv Manager ETF selection and you will notice it has had a steady but upward movement.
This group probably has the least risk as they are none-leveraged ETFs, but they are not balanced to equal the percentage of ownership by these managers. Also, they represent only the ETF portion of their accounts.
Our Algorithms currently move them up an additional 17% from an average 14% up to 31% of annual profit.
The long-term inflation adjusted return from the stock markets is usually quoted at about 7% and before inflation that is about 10%. The above 14% gained by our selections from these major portfolio managers seems to fit the numbers when you consider that they also have a major portion in Bonds at lower rates.
So, in longer term theory, if you adjust your percentages year by year and put approximately 30% of your portfolio into Bonds and the balance in our Investment Manager ETFs, you are a long way to meeting normal and average Market returns.
These numbers vary slightly each day.
Now suppose your 70% in ETFs is currently making 14% annual profit from above and you take one fifth of it and run it through our Algorithms, your new annual profit jumps up to over 17%. That is (14+14+14+14+31)/5 = 17.4%.
Once again, suppose you increase the portion through our Algorithms to two fifths of your investment, your new annual return jumps to over 20%. That is (14+14+14+31+31)/5 = 20.8%.
As you can see, for each fifth (or each 20%), that you run through our Algorithms, you gain one fifth of the difference in the annual return rates; in this case 3.4% for each fifth. That is (17%/5).
Obviously, we are using the widest held none-leveraged portfolios from our research, to arrive at this 31% annual profit. This is the most risk-free selection that we offer and based on our published results, would produce an additional EXTRA income of $17,000 each year from every $100,000 that you invested.
All you must do now is watch our Algorithms until you convince yourself that they are real and how well they work.
Available or Maximum $2,000 per Stock?
Complicated charts but we do have a reason for it. It became necessary when we began all investments on the same date, March 5, 2018, and then found it beneficial to list assets in alphabetical order.
The problem was everything was giving us a BUY signal on different dates and to top it off, the signals didn�t come in alphabetical order.
So, to show profits as a percentage of investments, we had to accumulate them until we reached our maximum of $2,000 per stock in each group.
So, why $2,000 per stock? No good reason other than it seemed like a good average number at the time. We knew we wanted to use a constant amount, the same constant start date and put everything in alphabetical order.
The problem now is we hesitate to change anything because the history and comparisons are easier to show and compare.
It probably makes little difference now as we almost have the maximum $20,000 in each group of 10 assets. It does make it easier to start new groups such as the ETF Prime 5 or the Pairs Trading because of these standards. We can replicate them all back to these standards, so I hope you can live with our methods.
Looking backwards, it probably would have been better to use $1,000 per stock but we already had to eliminate Amazon because the price is close to $1,700 per share.
We also often receive questions about the minimum investment necessary and we determined that $2,000 divided into 3 stocks would be ok, especially if the better performers are selected. Even with online commissions and subscription costs, this would make a workable minimum, but profits should be put back in and perhaps double that amount is a better number.
How Many Stocks to Own? Suggest you read all of the comments for today.
If you want to go crazy, just google this question and everybody has their own best solution, but it can help to answer the question for your personal situation.
My opinion on this subject is colored by my history from an early age when I first borrowed money to put into the stock market until today and my reasons to develop our Algorithms.
That is why I look at risk now as an older investor and why my absolute minimum would be 3 positions. One of them could be a Pairs position as you might only be in one side of the Pair at a time.
I would move to 5 positions as soon as possible and that would nicely line up with our new ETF Prime 5 group or any other selection from the entire 50 selections that we cover with our Boosters.
Of course, you could find 2 or 4 other systems and just use 1 from us and that might satisfy these minimums, but from my old experience, do not borrow money and put it into wildcat oil wells in Australia. Did that and lost it all.
So, the risk factor is first on my list, but you can also have too many positions.
My personal limit is a maximum of 11 because you can begin to duplicate your sectors and especially when you have all these ETFs available, you are already covering multiple bases with them. The earliest example is SPY which represents all 500 of the S&P 500 stocks. That one is like watching paint dry, but you can now select almost anything in vertical channels and ideas.
I do want to emphasize that we attempt to give you a well rounded and thought out selection starting with current world-wide Investment Manager favorites. Your own personal preference can be affected by the percentage of your investment account that you apply to each position. I explained recently that currently many of these Investment Managers have approximately 25% of their accounts in Total US Market ETFs.
Another 20% to 30% of their accounts are in bonds of various types and they select where the best returns are found.
We have looked at these bond ETFs as well and not surprisingly, our Algorithms also work very well on those ETF offerings. You can expect something in that category in the future from Roebuck Systems, but you may be disappointed with the returns. After all, few people invest 100% into bonds but bonds with an algorithmic kicker are a lot more interesting.
Some Useful Updates in June. Suggest you read all of the comments for today.
The 6 main groups of assets to choose from begin with the Investment Managers and Bankers Group which are updated to match large ETF portfolios held by Investment Managers. In the past year, they have produced 12% and our Algorithms have produced 30%, a gain of 248%. These are not leveraged ETFs but are widely held.
The second group are selected from the S&P 500 and have produced 77% in the past year alone and our Algorithms have produced 135%, a gain of 175%. These are all stocks.
The third group are 5 new ETF Pairs which together as a group, lost 8% but our Algorithms have produced 125% profit. Many investors like to trade long and short and here we take advantage of the leverage available in ETFs so that no short trading is required. Although they do not exactly switch positions on the same day, they sometimes remain in both positions effectively trading in a neutral position.
The fourth group are selected from Nasdaq and these are plain stocks. In the past year, they produced 242% with a buy and hold strategy and our Algorithms have produced 349%, a gain of 144%.
The fifth group are selected to represent Investment Managers and are leveraged ETFs that gained 33% on their own but our Algorithms have produced 97%, a gain of 290%.
The sixth and final Prime Group is a smaller selection of 5 from the above 50 that we publish every day. By themselves they produced 35% during the past year, but our Algorithms produced 89%, which is a gain of 257%.
The above percentages will change every day because our Algorithms are run every day after major US Markets close to provide the very latest information available. The daily Blog keeps you up to date on the exact results.
The two new groups named ETF Pairs and ETF Prime 5 are designed to offer smaller selections and more specific selections for Followers. These may be helpful for you to test our system of signals every evening. They provide powerful results that represent trading since March 5, 2018. We use this date as the initial publishing date for these specific Algorithms especially so that comparisons can easily be made.
What to do with the New Month Groups.
The same rules always apply. If the stock or ETF is no longer on any of our lists, you sell it at the next market open and replace it with any stock or ETF that is on our lists with a greater potential annual return.
If you want to try Pairs Trading, you could decide to add one of the Pairs as replacements to the next 2 sales.
Alternatively, what I do is continuously change to a different asset or group when sales occur, whether it is the end of a month or not. I am constantly trying to improve my portfolio every day and like to be an active trader.
As far as how many to own, my preference is at least 3 assets in any account for safety and no more than 11 assets, depending on your personal situation, your preferences or your retirement plans.
Tax exempt accounts are always handy and preferred. If it is available to your type of account, I would modify or open it as a Margin account for 2 reasons.
First, there are occasional situations when our Algorithms buy and sell on alternate days and you could run up against the T+2 Banking Rule which prevents you from using cash that has not settled yet. The use of Margin or borrowed money for 24 or 48 hours prevents all these trading problems.
Second, I have found that the Margin Interest Rate at your Brokerage is usually lower than any other form of loan or credit card, so it is a good place to borrow money. Unfortunately, you are not allowed to do this with an IRA or tax advantaged account.
One final point. We use a standard of $2,000 initial investment and a start date of March 5, 2018 for all assets so that easy comparisons can always be made between groups and assets.
One point to remember is that with Pairs Trading, you can assume that you will only be in one side of the pair at a time, although some overlapping does occur.
Statistics Worth Looking At.
It is often difficult to see where we are going when the DOW goes down 250 points and the S&P goes down 19 points but there are numbers in our charts that you can look at for better information.
For example, at the top of each graph, you can see the current annual return of that group of stocks as well as the S&P 500 since March 5, 2018.
If you divide our return by the S&P you can easily see how much better, we are doing. You can also add all the groups together to see an average annual return and divide that by the S&P 500.
The answer today is 64% average annual return for all Algorithms and 3.8% for the S&P. This gives us a number (just for today) of 64 divided by 3.8 or about 16 times better than those 500 stocks.
This number is going to get better as time slips away and I need to explain that. If you look at the History Data page of the website and check the Maximum Investment number just above the trade log for each group, you will see that only 4 of them today have reached $20,000 maximum investment or $2,000 for each of the 10 stocks.
This means that we have not yet invested the maximum in some of the groups, but within a month or so, we will reach that maximum for all calculations. We will then be counting all profit as a percentage of our fixed maximum investment and the final annual returns will be a higher and correct representation of the annual return.
However, after March 5, 2019 we will reach 365 days and another variable will become fixed and we can then ignore this whole subject.
How NOT to Trade your Account?
My lazy way to trade our Top-10 groups of accounts is a little different but offers a simple solution. It works if you are usually pushed for time, or perhaps if you are new to trading a group of stocks in a common account.
As you have seen, we many times have less than a full house of stocks due to some of them having been sold.
An example is trading all 10 of the Nasdaq Top-10 as I do in my IRA. We often own 7 of the 10 possibilities with 3 of them having been previously sold. This is where I have used a time saver.
If my cash from these 3 sales is $3,600 and I get a signal to buy one of them tomorrow, then I just divide my cash by 3 and buy $1,200 worth of the next stock. This is not my recommended system.
We normally suggest that when you buy back into a stock, you should use the same amount of cash from the previous sale of that stock to get back into your position. In this way, you are putting that same amount in to your winners as well as your losers.
This would be our recommended method of trading and I am wrong to ignore this principal. After all, when we make our selections, we always look at them in a best to worst order.
The large portfolios of investment managers that help us to make selections are divided into categories with surprising differences in values. Last month we found a couple of managers that are holding 60% of a multimillion dollar account portfolio in ETFs and 40% of that ETF total was in a single asset.
That represents about 24% of the entire portfolio was in a single ETF. So, if the big guys are going with their winners, we should do the same thing.
My quickie system will eventually spread my winnings equally but, I am wrong in mistreating my IRA this way and will go back to the preferred system ASAP.
Inverse PAIRS TRADING with ETFs.
We have done considerable pairs-trading going back to our days with volatility before Credit Suisse took XIV off the market place.
The great benefit is the issue of all the inverse ETFs for most popular Indexes and segments and the great opposing correlation between the positive and the inverse trade.
The disadvantages are the management costs of the leveraged versions that are otherwise tempting to use, if those costs could somehow be overcome. Well, guess what! Our Algorithms produce profits from positive and inverse ETFs.
We have scanned and back-tested 100�s of pairs and as expected, our Algorithms performed as previously demonstrated. On bullish assets, they quickly tend to get out of strong negative moves and stay with the positives.
The result is with good correlation, even though it is in opposite directions, we can take advantage of the diversity in their moves. The net in many cases is profits from both sides of the trading.
We are starting with a selection of industries from Biotech, Natural Gas, Semiconductor and Gold Miners with a final pair from the Russell 2000 stocks.
You will see these ETF Pairs in the ETF Booster slot in the June selections as several of them are already in that ETF published data.
New Ways to use our Algorithms.
Following the world of large investment managers is proving to be a great way to confirm selections of assets to form our Algorithm groups.
One of the great benefits is they represent high daily volumes which minimizes the bid/ask price spread when we make a trade.
Secondly, they represent broad universal opinion when deciding between large, mid or small-cap assets. This also helps the USA versus Europe or Asia decision that large portfolio managers need to know.
Our back testing has confirmed these advantages and has also pointed us towards broader uses of the Algorithms that we will begin to make available next week in the June selections.
The first benefit is in response to requests received to more specifically define a smaller selection of assets for you to follow. To achieve a new smaller ETF group of 5 assets, we have analyzed these managed investments to see what percentage of their portfolios is dedicated to which type of investment.
Consequently, you will now see this smaller group of 5 that we call our - ETF Prime Booster. We back tested the group but started the published data on March 5, 2018 so that easy comparisons can be made to all other selections. We will continue this trading forward from here.
I have added a chart here to show how well this Prime selection has performed with better than a 46% return in just 84 days. This translates to an annual profit of about 200%.
What you are seeing here is the wisdom of large portfolio managers made much more efficient by trading their positions through our Algorithms.
I keep mentioning this fact because it is extremely important to consider. During this period since March 5, the S&P 500 Index has gone nowhere.
How to Invest in Our Algorithms.
Yesterday I wrote that $500 investment in 10 average stocks selected from our entire range since March 5 this year, would have produced a 59% annualized profit so far.
Of course, if you had chosen the 10 Nasdaq stocks, your profit would have been more than 50% higher or greater than 90% annualized profit.
In either case, at our published monthly fee schedule, you would have also paid $1,140 to us from this $5,000 account so profits would have been 36% ($1,800) or 67% ($3,350) on the $5,000 investment.
Of course, larger investments would still pay the exact same commissions and fees, thus allowing much greater profits.
It is sometimes difficult to make the best selection of stocks from the 5 or 6 Top-10 groups, but I want to emphasize how easy it is to switch around from group to group or just select a mixture from several of the groups.
I reported earlier that I switched my entire selection in my IRA during May from the Total Top-10 group into the Nasdaq Top-10 by taking Sell signals in the Total group and Buy signals in the Nasdaq group. Loyalty to an investment is not required here.
All our published trades and results have been obtained in this lousy market for the last 3 months with the S&P Index going virtually nowhere. If we had started 6 months sooner, we would all be dancing in the streets, but we don�t know when the great markets will occur.
I am encouraged by our annual returns in lousy markets and really looking forward to better opportunities tomorrow or next month, whenever they return.
FTSE Replaced by Premier Selection.
Our new Premier Selection will replace the London FTSE Top-10 in June.
Added taxes do not help trading in London programs such as ours and we find UK investors often prefer to trade in overseas markets.
Our new Premier Group of Algorithms provides investors with a highly leveraged set of widely held as well as currently popular ETFs. Equally important is their diversification, which comprises of a popular current range representing broad portfolios.
We recently received a complaint that commissions are not calculated in our Algorithms and here are the reasons we do not include them.
Our average stock or ETF trades are less than 15 buys and 15 sells in a back tested 12-month period. At Tradier Brokerage, 30 trades at $3.49 per trade would cost $104.70 in an average year per stock. It should be noted that Tradier is offering new accounts $200 or 60 days of FREE trades if you use the code � Roebuck200.
If you make a profit of $1,000 in a year from trading one stock, you would pay less than 11% in commissions. There are many different Brokers with many different fees.
We also have accounts with Interactive Brokers where commissions are much less but Tradier is a well-designed and simple online brokerage site and that is why we use them. We do not receive any financial benefits from your choice of Brokerage and we have no financial benefits or agreements with anyone.
We do recommend that you find a Broker suited to your needs, but it would be unfair to most Subscribers for us to include a commission that does not represent their situation. You can simply multiply by 30, your commission and the number of stocks that you follow to see your estimated total cost per year.
If you wanted to follow any of our current Top-10 selections with a total of $5,000 or $500 per stock, your commissions at Tradier would be 30 x 10 x $3.49 for a total of $1,047. This is about 21% of your initial investment and the average annual profit on all of our published Algorithms since March 5, 2018 is currently 80% profit. This leaves an average of 59% potential profit on a $5,000 investment.
As you have seen, the average annual return has been rising since March 5, as expected, and any larger account reduces the significance of commissions as well as our fees.
Our fees are roughly equal to the Brokerage Commissions on the smallest account.
Reading Our Charts � VTI.
I see these every day and probably take them for granted as they have changed and improved over 7 years.
VTI is a great example because it is one of the widest held ETFs in managed accounts today. It is described as a Total Stock Market with about 98% USA equities.
The red dots represent the Buy and Hold profit if you held it since May 23, 2017 and the green line represents our results after using Algorithms. We kept making profits while VTI lost much of the previous gains during the past 5 months.
This is one example of what Algorithms can do but if this only worked on one stock over a particular period, then it would be easy to duplicate.
I urge you to look at all the stocks and ETFs that we publish to see the excellent record that has been established. As you have seen, we publish ahead of our trades and have no way to offer tricks and make believe.
I have also disclosed that our Algorithms are run every day without fail. We take the very latest information into consideration and drop off the oldest date at the same time.
Necessary Changes for Sectors.
GKN-LON is involved in an acquisition and had to be replaced over the weekend. AHT-LON has been added in place of it.
While we are making changes and due to low volumes, we are replacing FINU with FAS in the new Premier group. In this case FINU is a sale for tomorrow, so we will not buy the replacement FAS until we get a BUY signal.
Any Followers who may have a position in either of these should sell and replace them at the next trading day open. These are treated just like a normal exchange at the end of each month when we occasionally adjust the sector Top-10 groups as necessary.
By way of explanation, we estimate that an average of 1 or 2 stocks or ETFs in each Top-10 sector will be replaced each month because they no longer perform or need replacement for some other reason.
This process means that most of the selection could be replaced within one year. In volatile sectors, this is more likely whereas in more stable sectors, it may not be the case.
Month-end is the likely time that changes occur, and it just takes a simple sell and replace on the following trading day open.
SEE the ENTIRE PROGRAM.
If you look at the History Data page right now, you will see every trade on every Booster since March 5, 2018.
It is 74 days or 11 weeks since we began publishing our trades ahead of time to demonstrate our Algorithms and their success rate.
During these 74 days, the S&P 500 is up 1% and our average stock from over 50, is up 18% with a current and improving Average Annual Profit of 89%.
Let me say that again to be clear – Average 89% Annual Profits.
What are Premier ETFs?
Money Managers around the world are looking at the same data points that influence their investment conclusions.
How is Europe doing compared to the USA or compared to China?
Is China following the whole of Asia or is Asia more generally following China and who is manipulating their currency?
Morgan Stanley Capital International is often used in the name when you see MSCI in a description because Morgan designed many of the Indexes that specify a particular segment.
You often see EAFE associated with MSCI because Morgan also used it to stand for Europe, Australasia and Far East. It basically includes all these areas excluding the USA and Canada.
When Mutual Funds were the game in town, these standards from the giants in the investment community were useful in delineating trends and financial activity into various segments.
We search data to find what Investment Managers are doing but take advantage of the rapid growth of Exchange Traded Funds. They generally have the advantage of being cheaper to manage than your typical Mutual Fund, but they have the added advantage of leverage.
We find that using a broad consensus from Money Managers in choosing financial and/or geographical selections is an excellent basis for investment. Couple that with some leverage offered by ETFs and some Algorithms offered by Roebuck Systems and you have a great model for investing.
ETF and Banker Top-10 Selections Up.
All 10 of the Banker and ETF selections went up today which tells us that the smart money as well as the risk takers were investing.
There is a rule for every Market and you can go crazy trying to adjust your investments for whatever is the latest theory.
The reason I have ended up with Algorithms is precisely this fact. They take away those greatest and latest theories on where to put your money. Just give me the facts as Sgt Joe Friday used to say on TV.
I have added a preliminary chart to show you how we intend to break our Algorithms down to make useful and investable decisions from a smaller selection of opportunities.
We often hear that there is too much data on our website or too much daily information out there and it makes it difficult to decide what to invest in for the best results. I found that it was impossible to make the best decision because tomorrow brought some new fact or new idea that I needed to know more about.
Algorithms make all that decision-making jargon a lot simpler once you see consistent results and can logically believe in what you see. That is the reason for us to offer precise investment programs that are built on a long history of known factors.
Striving for Profits.
We started all current Algorithms on March 5, 2018 on the same day that we introduced them to the public.
Since then, 71 days ago, the S&P 500 has gone virtually nowhere for an annual rate of approximating 6%.
We introduced 50 Algorithms and traded them daily, representing a wide range of stocks and investments.
In those same 71 days, they moved up an average of 14% or an annual rate of 71% profit with the best selection of Nasdaq stocks near 150% annual profit.
We certainly chose a poor starting date based on Market activity, but it has been a great opportunity to demonstrate how our Algorithms keep us in profits during poor Market conditions.
The slowest group are the Banker Top-10 but they rose at a 26% annual rate of profit. At that rate, you would still double your money in less than every 3 years or about 830% in 10 years.
Yet, I said yesterday that we are going to introduce something better than we have seen in the past 7 years. I have great confidence in this statement because it represents a formula change that repeats itself in a range of assets.
I have already back tested and run these new Algorithms on real time data with great results and have a goal of June 1 for their introduction along with the regular monthly updates.
NEW Top-10 Fund Coming Soon.
Apologies for no Blog yesterday but I do have a couple of excuses. Mothers� Day would be one of them and working on Algorithms when I should have been enjoying Mothers� Day is the other.
Suddenly, there was no time for the Blog, but a new and improved fund will be the result in the coming weeks and I am anxious to bring the results to you.
I like the idea of someone more capable than me making some of the decisions and we plan on putting that into action in the next month or so with some very exciting results.
We are back to my argument that there is always a better way and the nice thing about mathematics is the numbers do not lie.
I fully expect the new Algorithms will produce greater results than we have experienced during the past 7 years and at this point, I intend to include it as part of our existing set of Top-10 selections.
It will most likely replace one of the current selections and I will give notice if that proves to be the case. It is difficult to replace something that is already making profits but when the technology and methods simply outdate previously published data, we just must use it.
One of the great advantages of all our Algorithms is the simplicity in following them and switching in between different Top-10 groups. I personally moved to the Nasdaq Top-10 recently by taking the SELL signals to get me out of previous stocks and the BUY signals to get me into the Nasdaq selection.
I also ran into the T+2 Banking Rule on a Corporate account and was restricted in trading for a day. I quickly changed the account to a Margin account which provides the extra cash on the few occasions that the rule kicks in.
It costs very little interest for the day or two that the extra cash is needed, and I prefer to trade on the signal day rather than stay out of a position.
No Blog Today.
A COUPLE of DAYS DIFFERENCE.
If you remember a couple of days ago, the ETF Top-10 was struggling due to the difficulty of owning them in down and flat markets.
What a difference a day makes! They are now #5 in the ranking and suddenly, they have a desirable annual profit and may catch up very quickly.
It always comes back to portfolio choice and your decision of what is best for your goals. A younger person has the time to be wrong (for a while), but if you are already retired, that luxury may not be available to you.
The middle of the road portfolio could be a selection of 2 from each group to get that spike that comes from leverage in strong markets. Obviously, your location may keep you in or out of the London markets.
20 years ago, or more, that leverage factor may have come from Options or perhaps Warrants or Futures but that required a set of skills that a lot of us didn�t perfect.
Another portfolio might be 5 from the Banker Top-10 which are also ETFs and is a selection from Fundamental Investment Managers together with 5 from the leveraged ETF Top-10. This could give you the confidence of expert selection advice combined with some of that leverage that looks so good.
Whichever method you choose, keeping an eye on that Banker Top-10 is always a good way of following the money.
By reading up on those symbols in the Banker group and the sectors they represent, you could then give expert commentary at your next Family Gathering!
GAMBLING or COUNTING CARDS?
My best session as a Card Counter was in the 1980�s in Monte Carlo when I walked away with about $7,000.
That is just about the time that shuffling machines began to come into favor and people like me had to rely on our careers. I am an Engineer with an inner risk computer and I use numbers and art to figure out solutions.
What you get with my Algorithms are fact-based calculations from many millions of iterations, which are always repeated every day, for each asset that we publish each evening.
So, what is the result? A better chance of being on the right side of an investment than being on the wrong side.
What I can tell you is you will have on average each day, somewhere between a 55% to 65% chance of being right in the long run. In fact, it is probably more like Card Counting in that I can only guess which card will turn up tomorrow, but I can calculate which cards are more likely than others.
I am risk averse and my inner computer told me to give up Card Counting when it was no longer a winning strategy.
What else should you know? GIGO is a computer term that I first heard early in my career when I worked on production scheduling. Garbage In � Garbage Out was a very simple warning to avoid Garbage.
If we feed the wrong data in, then we will get wrong answers, so the key is to find as much relevant data as you can and let the computer make the decision for tomorrow. I cannot currently tell you if it is a 51% chance or 65% chance, but I can tell you whether it leans to a Buy or a Sell and in the long run, I will be correct.
Finally, you should note that these basic Algorithms, with small changes, are producing positive results from all trading assets that we publish. They range from conservative to highly speculative assets. Tomorrow will be different than today but so far, we have not found a back test that does not benefit from our methods.
There are ETFs and there are ETFs!
The ETF Top-10 Booster is struggling to stay ahead of the Markets these days and quickly gives up any gains it makes in these volatile times.
The reasons are explained by the 2x and 3x leverage that these types of ETFs are designed for. This would be great if there were no severe penalties for us to pay for that leverage.
The use of Options to get the leverage introduces extreme time decays every day by them having a fixed strike price and date of expiration in the future. This becomes a cost of ownership and a daily loss.
In addition to this daily loss, there is a large management cost involved after every market close, to re-adjust the quantity and variety of options so that they will open on the next trading day with their particular leverage value and contract.
All these costs are overcome in a trending market but become more difficult to overcome in a flat or volatile market.
This is not true with none leveraged ETFs that are represented in the Bankers Top-10 Booster and many Investment Managers prefer to use these ETFs rather than Mutual Funds because the management costs are about 1/2% cheaper and can give them an edge in competition.
This 1/2% gives all of us the same advantage. Remember that Mutual Funds have annual management costs in the 1% to 2% range and this expense can make a big difference in large portfolios.
These savings are one of the main reasons for the fast growth of the ETF industry over the past 10 years or so and why we see them represented in major portfolios. An earlier version of them is the SPY which represents the trading values of all S&P 500 stocks in real time values.
How to Begin.
We suggest you start with the �Bankers Top-10� because they are the investment of choice by many International Investment Managers around the world. This group of assets trade more than $10 Billion dollars every trading day.
We also suggest you start with a minimum choice of 5 assets with $800 in each of them. Otherwise, if possible, available capital should be equally invested in 10 assets and profits from each re-invested in itself at the next BUY Signal.
On the first day, you should BUY only those �Bankers Top-10� assets that have a BUY signal and from that day forward, BUY or SELL at each new signal change that you receive from us.
These trades should always be placed at the �Opening Price� on the next trading day. Your Broker may call that a Market Order which can normally be placed any time before the Market opens for the next business day.
As you gain experience with our Algorithms, you can move further up the potential profit list of assets.
CHANGES for the BETTER.
Always looking for a better and simpler presentation, we added the Total Top-10 selection to the bottom of the 5 basic sector groups, putting everything on our new Chart number 4A.
Also, Chart 1X has been simplified by eliminating the gain over the local Index.
We now simply look at the Booster profits over the Buy and Hold strategy for each stock and group and rank their current results.
I do want to caution you that some of these leveraged ETFs can be stressful.
On the other hand, the Banker Top-10 are also Exchange Traded Products, but at the opposite end of the spectrum.
Having spent so much time with these Algorithms for 7 years now, I think our decision to leave the DOW in with the S&P 500 and then to create this Banker Top-10 Booster has looked good to me from the start.
It combines the knowledge of these top-level Investment Managers with their need to compete. Our Boosters offer a unique new ability to stay out of down moves and sharp reversals. They combine their skills, creating huge volumes with every known fundamental analysis method to stay at the top. They then look for an edge to make that extra percentage that can set them apart.
Our Algorithms can be that edge. Their potential gain based on back testing is currently 242% or 142% profit from Chart 1X with an actual annual profit since March 5, 2018 of 25%. This profit from a Market with an S&P 500 that has moved down -0.7% during the same period.
These are dazzling results for an industry that struggles to get 8% to 12% longer term annual profits for their clients. Not so dazzling when compared with the Nasdaq annual profit of 136% for this same period but so much less risk for moderate to conservative investors.
What I like to see is the strait line graph of this Banker Top-10 Booster which could be a strong indicator of future performance.
IMPORTANT INDEX REFERENCES.
London stocks according to the FTSE Index at Plus +6.1% are doing far better than our S&P 500 Index at Minus -1.9% since March 5, 2018.
All our published Sectors were started on March 5, just 59 days ago and you would expect USA stocks to be doing far worse than their UK cousins, but not so.
The Nasdaq selections are performing at an annual gain of 139% which is over 4 times that of our S&P 500 selections at 32% which itself is a great result. This is during this past 2-month period when markets here have gone down.
We have reported on the high tax that investors pay when trading stocks in London and one of the surprising aspects is the Electronic 0.5% Stamp Duty Reserve Tax payable on purchase of shares. When added to Brokerage fees, this puts a damper on any trading accounts.
At Tradier Online Brokerage where we keep accounts, we pay $3.49 plus a few cents tax on each trade and then I assume we all worry about income taxes after that.
Our new Chart 1X is a recent addition to make it easier to select which stocks or ETFs might be preferred investments. This is where you see the above sector performances.
Conservative investors will see and should consider the new Bank Top-10 selections from the Investment Bank world. This selection is showing a potential improvement on a Buy and Hold strategy to be more than 200%.
Current performance since March 5 for the past 59 days is 5.0% or an Annual Return of 18% and I need to state once again that we are in a negative market since that date.
INVESTING and SPECULATION.
Recent interest by Followers spurred our change to add strong investment opportunities to our Top-10 lists.
Although the DOW stocks are also listed in the S&P 500, they did represent a very popular group of assets even though only Boeing currently survives in the S&P 500 selection.
However, the improvement of replacing the DOW by the Banker Top-10 offers Conservative Followers more and great longer-term opportunities in well-chosen assets by experts in the field. This Banker list trades over $10 Billion daily.
As many of you know, the ETFs that work so well with our Algorithms over the longer term, do fall into a more speculative category and our goal here is to offer something at the conservative end of the spectrum.
For about twelve years, I have had the opportunity of working with several of the major money management Banks through my relationship with an ESOP or Employee Stock Ownership Plan. This is precisely where this Banker Top-10 idea comes from and it is surprising how many of these Money Managers are selecting the same assets in their portfolios.
My $10 Billion per day value comes just from the major USA listed stock market trades each day but our selections are made from major investment managers around the world.
This is a good time to repeat the Rule of Seventy Twos which I learned many years ago. If you divide 72 by your annual interest rate, the result is how many YEARS it will take to double your money.
Conversely, if you divide 72 by the number of years to double your money, the result is the annual INTEREST RATE that you need to accomplish your goal.
Of course, you young folks can keep doubling up this number to become extremely rich by the time you retire.
BIG CHANGES TONIGHT.
I think everything was updated by tonight, but a few stock charts may take until tomorrow.
One correction to make is my comment yesterday that the new Bankers Top-10 would trade less than other groups and I should have said more. They will average 4.5 trades per stock versus the average of 3.2 trades per month.
The graph of trades of the Banker Top-10 since March 5, 2018 does appear to be a smoother rise and that may well be associated with the huge volumes of those investment manager favorites.
Our Subscription Service begins today although all Subscribers will receive our FREE 30-days before billing at this time.
Today is also the day that we make any changes to the Top-10 selections in each group for the current month, but few were necessary, and we expect changes to be approximately 10% or an average of one change per group in future.
Followers will sell any stock that they own if it drops off their portfolio and replace it with another preferred asset. These changes should be made at the Market Open on the next trading day.
BANKER Top-10 REPLACES DOW.
The Banker Top-10 replaces the DOW Top-10 tomorrow. As indicated, the DOW are now included in the S&P 500 Top-10. Final selections for each group will appear tomorrow for the month of May.
There were a couple of changes during April, but our goal is to leave each selection at least for the entire month.
Even though our selections are made based on the statistics alone, there are situations such as price spikes for takeovers that have caused glitches in the groups.
The new Banker Top-10 is designed for those Followers who tend to stay with Asset Manager choices and we expect that group to stay more consistent.
Our Algorithms are working well with the Banker group with above 116% improvements on average for all ten.
Because of the extreme high volumes in this selection, the charts will show a more common ability for them to stay with trends and eliminate downtrends. With about 20 round turn trades each year, the recent activity shows about an 18% or 65-day average cash position for each of the 10 assets.
CHANGES and IMPROVEMENTS.
Remember me saying there is always a better way? Well here it is . . . .
Although I began these Algorithms by testing the DOW 30 Industrials, it has become evident that they no longer serve our current goals.
As the DOW 30 Industrial stocks are also in the S&P 500, they are already included as part of the S&P Top-10 selection and are a part of our monthly sort. We think we can offer a better service and variety.
Their replacement will be a group of the world-wide Top-10 favorites from the largest and best money managers. So, if you want to do better than your favorite Money Manager you should check these out.
One of our sources from these Money Managers is JP Morgan Asset Management and they currently manage more than 1.64 Trillion Dollars and have offices in more than 30 countries.
According to Paul Merriman and Richard Buck in a Market Watch article, the past 80 years have produced average returns of 9.7% to 12.7%, depending on your choice of Small-Cap to Large-Cap stocks.
Liz Davidson reported in Forbes Magazine that 11% return is difficult to maintain over a long period. It all depends on timing, fees, trading costs and of course, Uncle Sam will want as much as 35% of your profits.
That is where our Managers Top-10 Booster Algorithms can make the difference. These are 10 of the most widely used assets in the professional management of large and institutional portfolios and they appear in many of these portfolios for long periods of time.
Daily turnover is about $10,000,000,000 each day.
Our Algorithms average about 20 round turns each year for each of the 10 assets and our 1-year potential return currently stands at about 26% or better than double their current return.
We will include this new Top-10 group from major Asset Managers in the next few days.
ADDED Columns to 4T Chart.
We added 2 additional columns to the 4T Chart at the bottom of the Total Top-10 Booster Page.
This puts more data in one place for Followers and the first addition is the potential Days in Cash for each individual stock.
The second Daily % Gain represents the potential gain each day that the stock is owned. These are calculated from the Algorithm projections and do not come from any additional data or input.
All input to the various charts is derived from statistical evidence even though it may be from different time periods. It is combined to find the best day to buy and to sell.
We determine that based on the evidence that we analyze over the past approximately 6 to 18 months, that best day is tomorrow at the Market open. We then calculate and show the evidence with precise results obtained over the past approximate year.
Years of testing shows us that we can effectively use that evidence today and into the future, but we recalculate everything again after Markets close every day. It is not surprising that a few changes do occur since yesterday but relatively few and that is why our lists of Top-10 will only be changed every month.
In the past, we have made changes during the month, but only special situations will cause us to do that. If it happens, we advise to sell when a stock is removed from the selection and the replacement stock or some other stock in the group be selected.
WHY BUY or SELL on the FIRST DAY.
Yesterday I referred to some comments about the new T+2day Banking Rule that replaced the T+3 Rule last September.
Unusual volatility and higher turnover of stocks can still run into this rule.
Today I want to emphasize some facts about our Algorithms that may help your choice of when to buy and which assets to buy when a signal is given.
Our Algorithms are designed around the best day to buy or sell assets. Historically, the day they change their signal, produces the highest result.
Also, these signals have produced profits at about 65% of the time on that first day and all other days are less.
This is the main reason I mentioned yesterday that if you need to buy 3 stocks and you only have available cash to buy 2, I personally would buy all 3 of them in smaller quantities. This is solely based on that 65% number.
If you want to further refine this decision, you could look at the number of potential trades listed for each stock to judge the average length of ownership. Longer ownership could indicate a steadier rise rather than a more volatile rise. You could also deduct the Days in Cash to try to be more mathematically correct.
This is not a precise science but a stock showing fewer buys and sells is likely to be moving up on a more regular basis than a stock which relies on many trades to achieve a similar annual return.
It always helps to look at a chart of the stock to determine whether the recent gains are by a steady upward performance rather than a sudden spike that may indicate some actual or rumored activity such as a takeover or positive news item.
Finally, we changed our format to listing stocks of each Top-10 sector to alphabetical rather than the performance of each individual asset.
After receiving comments about this, we have added a new Chart 4T at the bottom of the -Total Top-10 Booster- page showing all sectors in order of potential results after using our Algorithms. The background colors identify the sector that they come from.
T+2 RULE & OBSERVATIONS.
This volatility in our Markets may well have you worrying about the T+2 Banking rules when you quickly buy and sell stocks and find a shortage of cash in your account.
We were discussing this today and thought it probably affects a few Followers as well.
Basically, if you don�t have excess cash in your account and if you sell a stock today, you can use the proceeds to buy another stock. However, the money from the sale today is not settled cash for 2 more business days.
That means you cannot sell the new stock that you bought today for the next 2 business days because you did not use settled cash to buy it.
Put another way, the cash from the sale is not in your account for 2 more days because it must go through the Federal Banking System before you can receive the credit for it.
If you were to try to sell this new stock within those 2 days, you would be selling something that you did not theoretically own yet. It can get a little confusing at times and usually when you want to sell something quickly.
The problem is leaving extra cash in your account for the few times this happens is not helping you to maximize your annual gains as it reduces your percentage annual gains.
Along these same lines of discussion, if you need to buy 3 stocks and you only have available cash to buy 2, I personally would buy all 3 of them in smaller quantities.
LONDON UP AGAIN.
The London FTSE 100 is making much better progress on the upside than the US Markets.
Now up over 8% since March 5, this equals the return of our S&P 500 Top-10 but less than half of the NASDAQ Top-10 which currently stand at 18.4%.
The Total Top-10 Booster is slightly ahead of the S&P 500 at 8.4%. All these gains are happening while the S&P 500 Index is still in negative territory for the same time period. With world leaders heading to the White House this week perhaps we will see some gains.
CHART 1C is WORTH LOOKING AT.
The new Chart 1C at the top of the Home Page and here is worth looking at for anyone comparing our performance.
I had this question this week and Chart 1C is a good item to watch every day.
Check the performance of our average profits compared to the performance of the S&P 500 Index over the same period.
As of Sunday, in the past 48 days, we are up 53.6% while the Index is down 3.1% and only the ETF Top-10 slowed us down.
This certainly gives you a warm and fuzzy feeling in this slow bear market, but the ETF selection needs some further explanation. We include 3x and 2x Leveraged Exchange Traded Products in the ETF group and they certainly are risky but offer superb performance in more normal times.
You just have to look at their Group Potential of 227% Annual Gain after our Algorithms to appreciate the relatively small negative return today.
At the end of April, we hope to publish a complete set of charts for all our selections and you will then see how their individual performances behaved in periods of negative movement.
I also commented that our Algorithms have been back-tested to 1990 which was the start of the VIX Volatility Index. This period covers the Financial Crisis of 2008 onwards.
Finally, I just must comment on the statistical nature of our selections. By themselves, they represent the Top-10 selection in each group that we offer. In turn, the selection is made from a basic number of 30 stocks in each group. This came about because the first group we tested was the 30 DOW Industrial Index.
We kept up the statistical selection of 30 stocks in all groups and have then selected the 10 that best fit our Algorithms and screens.
It is highly unlikely and statistically unreasonable, that our methods have produced 5 groups of 10 stocks that are below average, and I think the data that we publish ahead of the trades each day is convincing.
Free access to all trades continues until the end of April, and a further 30 days of free membership after May 1, 2018 applies to anyone who signs up at any time.
No Blog Tonight.
HOW WE MANAGE OUR ACCOUNTS.
Newcomers to trading a managed account may benefit from these tips that we use on our own accounts.
First, we establish our total commitment to invest in a Roebuck Systems group of stocks. We will use an example of $10,000 and 10 stocks, so that we invest $1,000 in each stock.
Assume we have 8 buys on the first day, then we buy $1,000 worth of each of the 8 stocks at Market Price on the next trading day open. We use the closing price of each stock to decide how many to buy.
We also round out the number of shares we buy to the closest number above or below the $1,000 unless we are at our maximum of 10 stocks.
In this case for the tenth stock, we use 98% of remaining cash available in our account because the value of the share can change overnight and this gives us a 2% buffer in case the price goes up before the next day open.
We hit the Trade Button to place these orders and wait until the next weekday evening or Sunday evening when we receive the next Buy and Sell signals.
Different Stock Brokers deal with placing orders in different ways and Tradier has a large Green button to place your orders. However, if you are simply selling a stock that you already own, you can click on the Button to the right-hand side of the - Stock Positions - which says � Close Position.
So now, we place the sell orders. It is possible that one or more of the stocks you must sell are those that you bought today so do not be surprised by that.
Now we must consider the T+2 Banking Rule which tells us we must wait 2 business days before the money from stock sales is available to buy more stocks. This is due to Banks having to move money through the Federal Banking System.
Tradier Brokerage handles this rule for us when we click on � More Balances � and it tells us how much - Settled Cash - is available. Assuming we have sufficient cash available, we next look for any Buy Orders that must be placed.
It's easy!
- Signals arrive each evening and should be taken on the NEXT TRADING DAY OPEN.
A BUY signal should always be taken the FIRST day it appears but may be taken anytime.
A SELL signal should always be taken the FIRST day it appears but may be taken anytime.
Advertising has Started.
Now that we have the Algorithms tuned and operational, we have started a more aggressive advertising schedule.
We plan to remove signals from the various charts on May 1 and continue sending signal details to our Subscribers after that date.
Many Followers are still with us from our volatility days and I know these new Top-10 groups will continue the quality of signals that we have previously published. Please keep the questions and suggestions coming as we always learn from them.
Subscribers should sign up a day or two before May 1, when subscriptions will begin in order to get your details onto the Email and/or Text lists.
A question came in concerning how the various Top-10 lists are chosen.
Using the S&P 500 as an example, we run lists of all 500 stocks and look at their details and performances over two years of history in as many as four different time periods and we then make our first selections.
This results in a short list of thirty stocks which are then run through final Algorithms to ascertain the Top-10 for the S&P 500 group.
This is repeated every month to add or eliminate any changes that occur and that is when you may see a slightly different selection at the start of each month. A change can occur on any day of the month, but this is usually on the My Top-10 Chart or the newer Total Top-10 Chart that includes all Selections including London FTSE 100 stocks. This is when you would immediately SELL a stock on the next trading day OPEN and replace it with another choice.
At this same time, you can choose to add the new replacement stock or a stock from higher up one of the groups. You could also choose a stock with a new BUY signal. This obviously depends on your own choices and portfolio decisions.
At Roebuck Systems, we are buying and replacing every stock in each Top-10 group without making individual decisions that various Subscribers might choose.
You may decide to invest in the top 5 each month or some more traditional way of making your decision. This could most likely and hopefully produce better results than our published Top-10 portfolios. Many of you are choosing a selection from more than one group or from all the groups according to personal preference.
Our goal is to find a small selection of 10 stocks out of each group and with the help of our Algorithms, enhance the performance as much as we are able. By checking and sometimes changing our choices twelve times each year, we fully expect that the portfolios will be different from year to year so that we stay with current performers.
We are excited at the results being achieved with the past 2 years of our selections. We find that history beyond 2 years has little performance or predictive value to our methods of research even though we have done back-testing to 1990.
DOW, S&P, Nasdaq, ETF & FTSE.
Finished with the updates after correcting a couple of errors this morning. You can now see a wide range of currently trading Top-10 selections from the above assets including London FTSE stocks.
As it turns out, the Nasdaq Top-10 has performed very well for us in this mostly down Market since March 5.
I certainly hope that this range of 50 stocks gives you the broad range and diversification that you seek for adding to or creating a great portfolio.
In every case, the Top-10 is continuously selected from the highest performing stocks in their group looking backwards up to a maximum of one year. If changes occur, they will be made at the start of each month.
In our accounts we will sell any asset as soon as it drops off the list of 10 and replace it with another stock from higher up the lists. In this way, we will actively maintain a maximum of 10 stocks in each portfolio for all 5 groups.
Preparations for NASDAQ and FTSE.
We have completed our preparations for adding the NASDAQ and London FTSE stocks to our Top-10 Booster selections.
Our Friday texts and emails are now distributed on Sunday evenings ready for Monday trading. However, as we progress over the weekend, you may see additions to the website.
Those Followers who trade in the London Markets will know that prices are quoted in Pennies or Cents in the UK and we will follow that practice, even though USA traders are used to Dollars.
Just remember that 2,000.00 pennies or cents looks very expensive, but it is really about $29.00 in US money.
Another quirk to note when looking at the NASDAQ Boosters are the high gains both before and after trading with our Algorithms and this also applies to any asset that has a high normal annual rate of return.
An asset that is returning 100% or 200% annual return or more is likely to be improved less by our Algorithms. It may only be improved by a 40% or 60 % increase. It will most likely still be a better overall investment when you compare your potential annual returns but the stock itself is contributing a larger percentage of the gain.
It comes down to that old problem of looking for low priced stocks and deciding they have further to go whereas an expensive stock may still be the better investment.
NASDAQ and LONDON Top-10.
We continue with this volatile Market and today was UP. I have mentioned in the past how placing all orders for the next day Open can work against us.
Not always so! When the Market points down and our signal indicates a SELL, quite often, with this Up-Down volatility, when we place that order tomorrow, the Market reverses at the open and we SELL at a higher open.
The opposite also occurs when the signal tells us to make a Buy for tomorrow, and we end up with a great lower Buy.
I have often mentioned the old calculation that we lose about 15% per year by ordering tomorrow as opposed to watching the Markets all day long.
That is in fact an old calculation and goes back over 2 years when we were concentrating on trading volatility using the now defunct XIV as well as VXX and UVXY.
The exact percentage lost importance when it became obvious that we could easily beat my first goal of a 30% annual return and quickly moved beyond 60% and subsequently now, well over 100%.
The heading today refers to a recent question I received about the NASDAQ stocks and why did we not include them. I was deeply involved at the time in working towards the London Markets and indicated it would come later.
What changed was this 0.5% Tax question for traders in the UK on top of generally higher brokerage fees. I am no longer confident that many Followers would be trading them as this fee is significant. However, having almost completed that work, my intention is to add a FTSE-100 Top-10 and then add a NASDAQ Top-10 at the same time.
Unfortunately, due to the larger quantities of NASDAQ stocks, the selection will be from the large and the midcap stocks and will not include those with smaller capitalization.
S&P 500 Top-10 Stays Ahead.
The S&P selection is staying in first place these days and probably will continue there until we see a few more days string together on the upside.
Very little help from the Indexes today but there is evidence of individual stocks making their own headway and not being distracted by the news that we discuss all the time.
Good stocks will always do well and beat the news cycle in the long run. Our Algorithms for the S&P 500 confirm this and are offering much better than average returns.
A Good Day at the Races.
The DOW came racing back today and we quickly moved into a positive result, as did all the Algorithms.
Today was a good demonstration of how fast this can happen, and we do not have to reach previous highs in the Indexes to demonstrate great returns for our Followers.
I had a good set of questions today and one of them related to the London Markets. The factor that moved that idea a little lower on our schedule is the 0.5% tax on trades. It surely takes a slice out of profits for London accounts.
I have not figured out the pain that 0.5% would put on an average account but it seems like enough to open an account elsewhere if possible. I believe that would only apply to a sale of stock and not the purchase, but it still adds up on top of brokerage fees.
Perhaps somebody from the UK could send us a more complete picture of these affects. We are fortunate in the USA to have very low brokerage fees and small taxes directly on trades and perhaps investing with a retirement account would limit these costs.
High Daily Volatility Favors S&P 500.
This elongated period of daily surprises does not fit with leveraged assets or small databases, but it does fit the S&P 500 with a wide range of assets.
ETFs suffer initially by the delayed signals to trade on the opening of the next day. Secondly, their high Leverage works against high daily volatility unless the signals are in real time.
The DOW only has 30 possibilities and lacks the benefit of the S&P 500.
We have back-tested a full S&P 500 Top-30 and offer it here for you to confirm.
500 choices give us the benefit of a selection that includes stocks that have good current performance immaterial of political periods of high daily changes in direction. How many times have you heard that the Trend is your Friend.
Yes, our timing was not the best to start a new service and yet the performance of Mathematical Algorithms is measured by the difference between our trade signals and the INDEX that represents them, so let me demonstrate a good way to see that.
I assume that our signals and the S&P 500 Index started on March 5, 2018 with zero difference. The Index opened on that date at 2,681.06 and closed on Friday April 6 at 2,604.47 for a loss of 76.59 for the period. That is a 2.9% loss.
Our S&P 500 Top-10 closed on Friday at a 2.7% gain giving us an increased performance of 2.9% plus 2.7% or a total of 5.6% improvement over the Index in a down Market in 1 month. That is the equivalent of 67% annual return.
So, what is a reasonable conclusion?
The entire list of 500 stocks on average without any choice have lost 2.9% in the last month but we don�t invest in average stocks. We first select statistically, from the better performing stocks and then statistically again, signal what they will do tomorrow with about a 60% to 65% accuracy.
ETFs will do better in the long run because they have 2x and 3x leverage and Markets have been generally pointing up for several 100 years but that same leverage is painful on the way down. It could change tomorrow, and we will eventually catch on to that fact.
For the different reason of lack of choice, the DOW 30 stocks are underperforming the S&P 500.
So, we are back to the Trend is your Friend. We ran the S&P 500 Top-30 over the weekend to give support to these findings and it closed on Friday with a gain of 4.6%. That is a 7.5% improvement over the Index in one month or a 90% annual return in a down market.
Trade Wars and Markets.
European Markets lost about 0.3% and Chinese Markets went up about 0.5%.
American Markets lost more than 2.3% showing that the general investing public here are not thrilled with trade wars today.
Hope is not a winning strategy, but we must live with hope for the present.
Our profitable S&P 500 Boosters ended yesterday 4.8% ahead of the Index and they ended today about 5.0% ahead of the Index so we moved in the right direction, but the Markets did not.
We invest in those things we can control and try to ignore those that we leave to others. Timing is a difficult problem and starting the current accounts on March 5 turns out not to be ideal.
However, 5.0% ahead of the Index in one month is a great place to be when the Index moved down 2.8%. As noted, the S&P 500 gives us a wide range of stocks to consider whereas the leveraged ETFs have given up ground.
Even the DOW 30 is not enough stocks to withstand this current spell of volatility and Index losses and leaves the S&P selection as the one outstanding area of investment. Since March 5, the S&P 500 Top-10 Booster is currently showing a 27% annual profit which itself is well below a normal projection.
The Booster Next Day Trades will in future be sent out to Subscribers and Free Trial Members on Monday, Tuesday, Wednesday, Thursday and Sunday evenings.
This Sunday it will show 10 Sells, mostly in the Leveraged ETF selections, further indicating a good time to step back to the sidelines.
Shear Volume Favors S&P 500.
500 of the most well-known Companies in the S&P Index have a large numerical advantage over the 30 DOW Industrials.
We get to select only ten from each group which gives us a much larger number to pick from. Not surprising then that the S&P 500 Top-10 are the best performers so far, simply due to the large number of available stocks.
ETFs are going to behave differently because of the high leverage that affects most of them. Their construction methods use large numbers of Options for each stock to obtain the leverage.
Balancing takes place after the close each day so that the next day opening price will move at 2x or 3x the movement of the underlying stock.
Options at set strike prices will move much faster than the stock price depending on how far away the option strike price is from the underlying stock price. Calculations are then made to represent the leverage needed for the ETF but those calculations only last for a short period of the next trading day.
It becomes extremely complicated to follow exactly because many options at different strike prices change values at different rates.
On top of the pure relationship change between strike prices and underlying stock prices, there are 2 more factors that will affect the leverage ratio as the day progresses.
The first of these is the Volatility of the underlying stock or on the overall Market, which can pump up prices or reduce prices significantly in just a few minutes or hours.
The second of these is the Time-Value of each individual option. The value of an option which is set to expire next week, will move much differently than the identical option that may have 3 or 6 more months of life before expiration.
The calculations and adjustments that must be made for each ETF every day, just to produce the advertised leverage, bogle the mind. Even if the underlying stock were to close at the exact same price as the open, a completely new set of options would be needed to produce that leverage for the next day due to the Volatility and Time-Values.
With all that said, leverage in either direction can be good or bad, but it introduces a level of risk that must be considered. This recent down move produced greater losses in this group just as it will produce greater gains when the market turns up again.
Finally, the My Top-10 Booster contains a few none-leveraged stocks from the S&P 500 Top-10 group and this will place a smoothing factor on losses and gains compared to the pure list of ETFs
A Question on Duplicates.
All 30 DOW Industrial Index stocks are also in the S&P 500 stocks and duplicates will occasionally appear in our Top-10 selections.
An example of this was ADBE which moved up into the bottom of My Top-10 selection in April when we already owned it because it was already a buy in our S&P 500 Top-10 selection.
Confusing � yes, but some traditional as well as statistical based followers could read that as a positive for ADBE, whilst some followers might see it as needless duplication.
BA (Boeing) has been a duplicate for some time as a good performer but was also affected greatly by the sudden tariffs on Aluminum in early March. As stated yesterday, our selections are strictly based on the potential annual return after applying our Algorithms.
A stock that is performing well with a gradual increase in price such as Boeing, may not always be improved as much as a slowly rising stock but the final return of Boeing PLUS the Boost by our Algorithm can still be the best position to hold.
Our selections are based on the best overall performance which includes the stock price plus the added potential that our Algorithm improvements offer.
We see a lot of losing stocks turned into profitable stocks simply because we tend to remove down moves and stay in while they are moving up but not many of those appear in the Top-10 selections.
One of the great benefits of a small monthly change in our Top-10 selections each month is our ability to move with the times and with popular trends. Just one new addition each month can completely offer a different selection as a year goes by and that is what keeps our statistical choices in the best potential performance areas.
How many times have we all looked at lists of best growth or lowest Price-Earnings Ratio stocks, only to be disappointed by our own personal selection from that list.
Our purely statistical selections can find those stocks that have in fact already delivered some good performance and show a likelihood of following their path for a while longer. If they do not perform, they soon drop from the list and we move on to more fertile selections.
Our stocks from DOW and S&P are reported all day long in the Market Statistics given out by almost every financial news source and have been there for many years.
We add to that, a selection of the new ETFs that offer the more risk-oriented investor a place to invest. We then offer My Top-10 which is simply a compilation of the 10 best all round potential performers from other lists.
These last two groups will perform poorly in a down Market but offer much greater performance in up Markets simply due to their built in Leverage and longer-term risks. Whereas Corporate stocks most often have an Investor Page on their website, ETFs have a Prospectus Page detailing their management methods, construction and risk levels.
A Conversation Worth Repeating.
Sometimes I am not seeing the obvious and questions are very helpful to me.
My Algorithms are the result of a purely statistical background based on many years of trying to invest in almost everything. I do not do traditional analysis, PE ratios or industry selection.
Everything is a numbers game for me.
However, you can apply your own ideas and select which stocks or ETFs to follow or you can be a statistical animal also.
For instance, we have a great selection of opportunities to choose from.
Whatever your method for selecting assets to follow, some knowledge of stocks that offer a better future is certainly a benefit to feeling good about which Algorithm might work for you.
On the other hand, 2 or 3 selections from each group could also be a good statistical way of rounding out a personal portfolio that is more to your liking.
The important piece of information for you to know is that we have used pure statistics to make our selections and we do not read the Wall Street Journal every day to influence these choices.
New Booster Algorithms.
Welcome to our Booster Algorithms and to our daily service and free 30-day trial. Not the best day to start although it is better to begin when Markets are down rather than at their highs.
You will receive our signals every evening with all the Buys and Sells on the three groups of Top-10 DOW, Top-10 S&P 500 and Top-10 ETF products together with My Top-10, which is made up from the 10 potential highest returns from all three groups.
The Top-10 S&P 500 is performing
well in the current Market and the leveraged ETFs are struggling below the S&P 500 Index. This is typical of these leveraged ETFs and should make up the difference as Markets become more related to performance as opposed to the daily news cycle.
Our number 2 charts detailing the real performance since March 5 will be found on the History page of our website and we always take all trades on all assets as indicated by the daily signals.
The 12 months back test for each asset selected can be found on the individual Top-10 page.
Finally, the number 1 chart has the current Top-10 selection from each group and is sorted by the potential return after applying the potential gains after applying our Algorithm.
New April 2nd Trades at the Open.
Following a large number of Sells recently, it looks like we are reversing that position on Monday morning with a large number of 23 Buys and just 4 Sells.
Leveraged ETFs tend to be very volatile and they are a significant portion of the trades.
Our FREE 30-day trials start tomorrow evening and these signals will in future be received by our Email and Text Lists of Followers each evening.
Notice the color coding to more easily follow the 4 main groups of Top-10 selections.
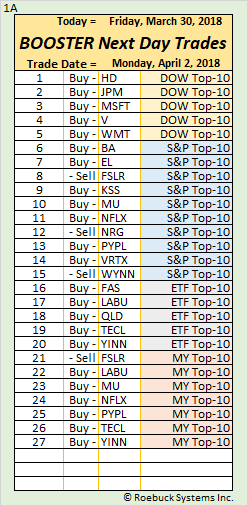
Revised Top-10 Selections for April.
As previously mentioned, we expect to review and change the selection used in each Top-10 group every month if appropriate to our Algorithms. You will see any changes today.
If a previously listed stock or ETF is no longer in the Top-10, we will Sell it and BUY the replacement if a buy signal is indicated.
Our Top-10 trading logs take all signals from all listed selections with no preferential choice and you may well have different results depending which of the selections you choose to trade.
You will also see some new numbers on our trade logs representing the Investment. First is the total amount Available for trading the 10 selections. In most cases we currently show $2,000 for each with a total of $20,000 for the group.
The next number is the Maximum Invested from the $20,000 total. This allows us to calculate the Profit from that Maximum Investment so that our Profit Percent can be related to the investments made to date.
You can also see the results on the graph along with the relative position of the Index that best describes the Markets.
Finally, My Top-10 Booster is a selection of the highest returns demonstrated by the other three Top-10 groups of Algorithms. In other words, it is the top 10 of the other 30 selections in the Top-10 DOW, S&P 500 and ETF groups.
FINALIZED MANY DETAILS.
Bounced back today staying well above the Market Averages.
It probably is a good idea to mention our Broker again even though we have no financial relationship with them other than having a few trade accounts.
They are offering 60 days or $200 of free trading to any new accounts that use our code of ROEBUCK200.
I mention this because my brother in the UK reminded me of the tax that is levied on every trade which really punishes short term trading.
Tradier charges $3.49 per trade and is a very friendly website for followers of our Algorithms, especially as we make all trades at the next trading day opening price.
On their site it is classed as a Market Order that can be placed any time after the previous day close and the next day open.
I MADE AN ERROR.
These up and down again markets have problems of their own and we are dealing with them, but start-ups have their problems too.
In the D2, S2, E2 and M2 charts my formula that creates profit percent and the trading log each day had an error and we were regretfully reporting incorrect numbers. The real numbers are not so bad so that makes me feel a little better. They are now correct. Tonight, since Mar 5th the DOW is down 2.5%, the S&P 500 is down 2.8% and our combined accounts are down 0.27%.
While we are cleaning up glitches and getting ready for the opening day next week, we had an email outage for the last couple of days due to a GoDaddy outage for some of our employees.
Our S&P Top-10 is leading the pack as of today and we are a little closer to offering a FTSE100 Top-10 for my London friends and relatives. I wonder if they will ever switch to Pounds instead of trading in Pennies and fractions of a Penny?
However, it does remind me of when my brother and I used to get a Sunday Penny after the war to get some Lemon Sherbets.
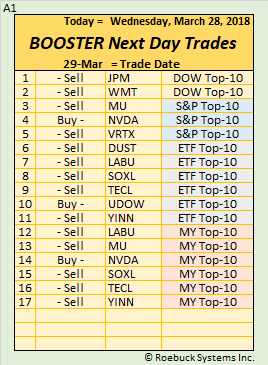
A lot of selling at the open tomorrow and many of you will remember that our best assessment is that we give up about 15% of profits because we place all orders at the opening of the next day. We calculated a few years ago that if we watched the market all day waiting for signals we could improve returns by approximately 15%. We next decided that by doing that, there are so many intraday false and maybe signals that we are better off not staring at a computer all day.
SERVICE STARTS APRIL 2.
Finally, we are ready to go with daily signals to all our Followers with free service for 30 days starting on the first trading day on April 2nd.
We very much appreciate all those who have followed our progress and especially pleased that our Booster Algorithms are working so well across most asset classes and types. Now with 30 selected stocks and ETFs in 3 groups of Top-10 DOW, Top-10 S&P and Top-10 ETF categories, we believe this service is a winner.
We have also added a new feature we call My Top-10 Booster, which provides my selection of the top 10 Booster Algorithms. This may be just for those seeking exceptional results but most of the assets we follow trade at least 1,000,000 shares each day and represent many different industries.
To make it simple, each Booster shows a current Buy or Sell, and all trades should always be made on the FIRST day the signal switches from Sell to Buy or Buy to Sell. All trades should then be placed at the next trading day opening price with your Broker.
We started trading all these Algorithms on Monday, March 5 th. and you will see that a few have not yet provided a Buy signal. We are staying with our selection which does not change much but will generally only be changed at month end. If a stock disappears from any selection, it should be sold and replaced with one that is higher up on your preferred list.
For new Followers or Subscribers, the Buy or Sell signals can be taken at any time but the first day of any change is always recommended.
Ways to use these Algorithms.
My experience in choosing where to invest for the opportunity to increase wealth has spanned almost the entire list of opportunities. I need to first list a few for relevance.
Stocks, Warrants, Options, Bonds, Futures, Funds, Real Estate, Antiques and Stevengraphs make up my short list. Also, I have used Managers, Advisors, Brokers, Banks and Casinos. (I used to count cards).
What do I choose now? I am older, I have time, I am good at Math, I know Computers and I create Algorithms.
Previously, I was an Engineer, but I have made anywhere from a loss to about 8% annually from investing, so I decided to try to make 30% with Algorithms.
Today, after more than 6 years, I can nearly double the annual return of an average exchange traded stock and with choice, I can do better and that is what you must do now.
You must choose from an array of DOW stocks or S&P 500 stocks or a range of the relatively new Exchange Traded Funds.
I have already pre-selected my Top-10 in each group and you can carefully select your own portfolio. The selections you make are from groups that represent 60% or more of US Traded assets.
If you have $1,000 - $2,000 to invest, you might select 2 or 3 Symbols that appeal to you from news stories.
If you have $5,000 - $10,000 to invest, You might select 3 to 5 Symbols that appeal to you.
If you have $15,000 to $30,000 to invest, you are probably in the range of 5 to 11 Symbols in order to spread your risk.
I was once advised that anything above 11 Symbols puts you into your own unique category.
The final point I must make refers to each preferred Risk/Reward personality. As I said, I used to count cards at Blackjack and made a good return in Casinos both here and overseas, but then some Engineer designed automatic shuffling machines, making me happy that I had a regular career. That puts my type at a high Risk/Reward and my selection has a Top-10 page all to itself.
Most people I know do not fit this group and might select a mixture from the DOW, the S&P 500 and the ETF selection. We provide the signals and you must choose which ones to take.
BE CAREFUL WHAT YOU WISH FOR!
Thinking that I alone had the Golden Egg, I was of course following the Top-10 of all the Algorithms in all the three groups of DOW, S&P 500 and ETF selections.
My math is ok, but maybe my stock selection needs a little work.
Algorithms are amazing things, as are Computers, but I have received another reminder from the old days called GIGO.
Garbage In � Garbage Out.
It turns out that during the last couple of weeks since we started on March 5th, the Dow 30 Index has lost -4.0% and the S&P 500 Index has lost -3.6%. We probably can assume that any Index of ETF selections would have lost more than that due to leverage.
So how have Roebuck Systems Algorithms performed.
DOW Top-10 went down -2.9%
S&P 500 Top-10 went up 4.3%
ETF Top-10 went down -0.2%
Malcolm Top-10 went up 3.4%
The S&P 500 has performed better than everything else at plus 4.3% in this market while the S&P Index went down -3.6%.
So, be careful what you wish for because my Top-10 list made 3.4% which was worse than the S&P 500 which made 4.3%.
This looks odd until you take a closer look and remember the leverage which is associated with most of the ETF products. They are geared to move lower or higher than the assets they proport to represent.
With that said, GIGO can be at rest until the next scare and I for one am pleased that for now, the average DOW and S&P 500 stocks went down -3.8% while the average DOW, S&P 500 and ETF Top-10 choices went up 1.2%.
In fact, if you look at chart M4, which is currently on a new page, you will see that none of the DOW stocks are represented in my Top-10 selection. Of course, there are only 30 stocks in the DOW Industrials, so no surprise is appropriate.
Also, let me share a little secret. Down below, you will see Chart A1 which for now, shows the current date and the Booster Next Day Trades which are not currently official.
YOU MAY HAVE NOTICED . . .
We are progressing quickly and will shortly announce the beginning of our complete program for distributing these DOW, S&P and ETF signals.
All previous Followers and new Sign-Ups will be receiving those details first and I have received many favorable comments so far. I hope you will find the Algorithms and their signals to be helpful and can use them profitably.
As I noted previously, we are following all signals from all 3 groups of assets in our own Account Log. While we will run this as a free program for a while, we will continue to announce changes as they occur in the coming weeks.
One of the changes will be the selection of 30 Stocks or Exchange Traded Products that we follow. These changes will be minimized as much as possible but will change over time as particular assets lose usefulness or as better assets replace them. Larger than normal changes will appear this coming weekend.
Obviously, the DOW 30 Industrials will remain constant until Dow Jones needs to make changes due mainly to acquisitions.
With online trading becoming popular, Brokerage fees are not a major factor and as a rule, we will sell all assets that leave our lists of 30 and wait for signals to buy their replacements. We do not include Brokerage Fees in any of our calculations as there is still a wide range being offered. However, we do list our estimate of annual trades for each asset in the charts if you wish to take this into consideration.
NEW BUYS and SELLS TODAY.
This chart shows the new buy and sell signals to be placed at the open for the Wednesday Open tomorrow.
They are highlighted in red.
This is the latest chart with all positions being kept in alphabetical order rather than in date order.
As initially noted, we are following all 30 positions that appear in our three groups of DOW, S&P 500 and Exchange Traded Products but many Followers will have different total results depending on your choice for your own accounts.
The new graph shows actual results to date and the averages from each of the three groups can also be seen.
Note also that we show how many current positions we are holding as well as the average percentage of days that we expect to be in cash. This condition can improve your returns if you choose to invest all or a portion of these cash days into stocks.
Profit on invested cash is currently running at $3,583 with an annual return since March 5 th. 2018 of 197%.
A FEW POINTS of NOTE.
We currently have three Top-10 asset groups selected from the DOW 30 Industrials, the S&P 500 Index and various Exchange Traded Products.
Generally, we have eliminated low volume assets which could present a problem with multiple traders. Higher volumes tend to produce smaller bid-ask spreads when trading.
Our selections are based on improved potential annual return AFTER APPLYING our Algorithms over a period and therefore may not increase a high performing asset as much as a lower performing asset. However, this is not a general rule as seen from the individual performance charts.
For example, we have cases within the groups that perform well, even though the underlying asset may have made a loss when held for the same period. One of the facts surrounding our Algorithms is that they stay out of almost all assets that enter a declining pattern and often make a profit just from the short periods when the asset turns positive.
For these reasons, it may be helpful to glance at the individual charts for all listed items to see their ability to handle high performing assets whilst also handling low performing assets. In a similar way, they also perform well when a sudden change in direction develops in their own market or in general market reversals.
It is true that our original Algorithms were developed to perform in the areas of volatility. The newest and most exciting aspect is their use within almost any market that we select and due to the interest proving to be almost 50% outside of the US Markets, we plan to extend to foreign markets within the next year or so.
As I was born in Coventry in the UK before ending up here in Chicago, it may well be London and the FTSE 100 calling me home.
As always, if you open a new account at Tradier.com and use the code ROEBUCK200, we will receive nothing, but you will get 60 days or $200 of free trading. We are not associated in any way with Tradier, but we do operate some of our accounts with them.
HOW WE TRADE THESE ALGORITHMS.
We have been trading and publishing all 30 stocks and ETFs from March 5 th. in our Roebuck Systems Account Log when we first see a BUY signal and selling when we first see a SELL signal.
All trades are placed at the Opening price on the next Market Open Day.
Trades can be placed after receiving our daily evening email signals. Duplicate Phone Text Messages are also available to USA followers and Others who can receive them.
The full program will begin within the next 2 weeks and initially, all Followers will receive all signals. A Charter Member starting date will be announced later when subscription services will be available.
There are many ways to select how you wish to follow the signals depending on the amount of risk/return you choose. We are trading all 30 selections on a continuous basis to demonstrate the ongoing results.
We trade at Tradier.com Brokerage and you may receive 60 days of Free Trades up to $200 if you open an account with Tradier using the code ROEBUCK200. They charge $3.49 per trade.
Beginners could invest $1,000 in just 1 stock from 1 of the Top-10 groups to test the program. For myself, I would probably select 1 or 2 from each group or perhaps choose from the S&P 500 or ETF selections if I chose to increase the risk/reward.
Larger accounts might choose to buy the top 5 from each of the 3 groups. There are many ways to balance your investment style as you go forward and you can always look at our performance Account Log shown above and see at the bottom how each group is performing.
Another interesting number at the bottom of the Account Log tells you how many OPEN positions we have and what average percentage of our account is invested at any time.
You should also note that our log is invested in all 30 assets whereas higher results may be achieved if selections are made from the top of the lists.
END of WEEK UPDATE.
We have updated the Algorithms for the end-of-week positions and signals. These are as of the close on Friday, but it should be noted that some changes may occur over the weekend.
You can see that all Algorithms are based on the Top-10 selections of assets in each of the three categories that we currently offer. That is our selection of the Top-10 DOW stocks, the Top-10 S&P500 stocks and finally the Top-10 ETF and ETN products.
Our current selections may change slightly over the weekend while we input the latest information available to the Algorithms.
It is highly recommended that a last check of this BLOG and charts be made before any signals are assumed as final for the next market opening.
There is still work to be done on the website and you will still see changes before the end of the month.
Early Account Results.
We started trading the 30 Algorithms on March 5th and these are our current results. As usual, they are based on trading at the opening price following the signal. We currently have 21 positions.
SAMPLE of ALL 3 BOOSTERS..
Having now completed samples of all three DOW, S&P and ETF Booster Algorithms, here is a first look at the results.
Obviously, we are extremely pleased with the ability of these Algorithms to sort out their best results from a range of investment assets.
We started with the DOW 30 Industrials as a trial of a broad but well-defined group of stocks that are widely held in many portfolios and they offer the opportunity to fine tune and boost the annual returns that can be achieved by every investor.
Having seen those results, the natural move was to a much broader range as defined by the S&P 500 Index and we also select a Top-10 group to offer daily signals.
Finally, today you can see the last group of Exchange Traded ETF and ETN products that have been applied to our range of Algorithms with even greater potential.
This puts us much closer to offering daily support in these three ranges of assets and we are progressing towards a better-defined website as well as more description on how these can be traded.
Current DOW and S&P500 TOP-10s.
Here�s a look at the current TOP-10 candidates and the increase in annual profitability after using our Booster Algorithms.
We started traded these results last week and as always, we will soon publish the results for all to see ahead of any trades.
DOW and S&P500 BOOSTERS.
Making great progress in aligning our Booster Algorithms to the DOW and S&P Favorites.
The idea behind these charts is to select the DOW 30 Industrials and also 30 of the best performing S&P500 stocks and apply our unique Booster Algorithms to greatly improve profit performance.
We began trading the Top-10 of each group with very positive results. The concept has not changed much from previous Algorithms other than needed modifications but we have tweeked them to resist negative turns slightly.
We will soon demonstrate a sampling of the charts with very accute ability to accept positive moves but resist negative moves. I am posting today a group of charts for the DOW and for the S&P500 selections.
Early days but exciting progress.
TEST Booster UPDATE.
More testing and some very interesting results.
We tested some more high volume ETFs and ETNs across the board to see what kind of results we would obtain. Some of these were also suggested by followers.
What keeps surprising me is the fact that we turn negatives into positives - how great is that?
We also tested ZIV in our forthcoming Volatility group as we would like to get into VIX derivatives as there are quite a few to choose from.
We cannot do a daily run on any particular stocks but if you have suggestions for singles or industry groups while we are in the testing stage, they would be welcome. When we do get started again we will offer daily updates with appropriate signals.
DOW Booster UPDATE.
Here is a follow up of a typical end of day Dow Chart.
Still working on systems for daily updates but will post charts and data as we progress. I don�t advise using these signals currently as they will not be available every day but it does show how useful it will be within a few weeks.
You can see that INTC is shown as a buy for tomorrow.
LOOK at the - DOW BOOSTER.
Here is the first look at the procedure for our Dow Booster program.
Monday morning gave you the new signal to buy Coca Cola Co. (KO), at the opening price if it was one of your preferred portfolio stocks.
It certainly benefits from applying our Algorithms. In the past 12 months it benefited from a 5.7% annual yield and moved up to a 15.8% yield. Total days owned was 225 out of 252 tradable days in the past year.
Would you choose to buy it tomorrow?
I cannot make that decision for you, but I have some mathematical facts that our proven Algorithms have consistently produced over 6 years and publicly demonstrated for more than 2 years.
Just look at Chart E, at the column marked - Action at Next Open. You will see all 30 Dow Industrial Index stocks, with their current Last Price and the annual gain before using our Algorithms.
Next, you will see the algorithm signals uniquely generated for each stock. They indicate either Own/Buy, In Cash, New Buy or New Sell. Following that column, you can see how many Buys and Sells occurred during the past 12 months. If it is still owned or is a New Buy, there will be one less Sell. If it is In Cash, our Algorithm is indicating no current ownership of that stock and the Cash may be reinvested in other Dow stocks.
There are usually 252 Trading Days each year and we have subtracted 3 additional days to allow for buying a different Dow stock and assumed that you would then be invested at the average annual return rate which is indicated at the bottom of the column headed � Gain After Algorithm. We assume this rate for all - In Cash - days for all 30 stocks after eliminating the 3 days for each of them.
To complete the explanation of this current Chart E, if you divide the average - Gain After Algorithm - by the average - Gain Before Algorithm, you will get 1.94 which represents the 94% Accumulated Algorithm Gains.
Finally, if you add the average � Gain After Algorithm - to the � In Cash Days Invested, and divide the total by � Gain Before Algorithm, you will get 2.60 which represents the 160% Total Accumulated Gains as a potential minimum annual return.
Why do I say � potential minimum?
For example, my personal plan would be to invest in less than the entire 30 Dow stocks and choose a changing portfolio of the best 5, 7 or 9 stocks chosen from the highest - Gain After Algorithm column. When our Algorithms kick one of them out of my portfolio, I would simply replace it with the next highest stock that moves into my portfolio.
I might complicate the selection by assigning a different percentage of ownership to each stock in my portfolio based on the performance indicated toward the top of our chart.
If I worked at Cisco or already owned some Apple stock, that might also affect my choices, but I would still Buy and Sell from our signals to improve the returns.
Finally, I probably would not Buy Coca Cola based on my own Algorithms. From the past, it made 26 trades in 225 days of the past 12 months and still only produced 15.8% of profit.
LATEST CHART for DOW INVESTMENTS..
This is an example of the work on the Dow 30 Industrials although the signals were given on different days this week and are not current.
We are using Cash to reinvest into an average stock minus the two days of cash T+2 banking rule for available funds.
As we continue to have progress I will post items of interest.
The point of posting this chart is to show that none of the 8 losing Dow stocks show a loss after using our new algorithms and the average gain is 112% more than your buy and hold strategy.
If you reinvest available cash in an average Dow stock at 33.4% the annual return increases to 181% more than a buy and hold strategy.
NOTES ON TRADING THE DOW.
We have redirected our energy into finding an alternative to trading XIV and Volatility and we are finding some very good and less risky alternatives.
The main change has been recognizing that our Algorithms work on many stocks, indices and ETFs. Certainly, we must modify our Algorithms each time, but finding alternative investments has become more important to our efforts.
We created mathematical algorithms from years of development, but simply finding alternative investments is not so difficult and is less time consuming.
I have spent time this week looking for better computers but also looking at aspects of trading the general markets for leverage and less risk. You have seen our results for individually trading the 30 Dow Jones Industrial stocks.
Now, I want to show you three available alternatives that can each run through our system with surprising results. The new chart E1 contains these results and we offer the following explanations and comments.
The top part of the chart summarizes the 30 individual stocks from the original chart E, showing the combined average results from trading all of them on an individual basis from a few days earlier 12-month period. Basically, traded with equal money on each, they produced an 18% profit and our 30 individual Algorithms produced a 35% profit.
That works out to 193% gain or a year-end profit of 93% after 219 trades with an average invested period of 162 days or 64% of the 251 trading day year.
The bottom part of the new chart shows individual results for Exchange Traded Products that each profess to represent the Dow Jones 30 Industrials.
The first DIA is a long time favorite and returned 22% versus the 18% of the original accumulated individual stocks. That seems a little odd but many of the construction and trading techniques could each partially explain it and that is not my interest at present.
The second DDM is a 2x leveraged ETF by Proshares set up to do twice the performance of the Dow Industrials. It did more than double with the past 12 months reporting a 48% return. Again, internals and trading may well explain those differences.
The third UDOW is a 3x leveraged ETF by Proshares set up to produce three times the performance of the Dow. It also did more than triple reporting a 78% return. Once again, we will not go into the reasons why this might be.
This chart E1 is to show what happened when we ran all 30 stocks as well as the 3 individual ETF�s through our modified Algorithms. Obviously, the straight DIA at a 22% did not benefit as much from our 24% result. One reason that I can see is the difference in the quantity and value of signals when fine tuning is reduced to 1 signal per day versus 30 individual signals.
Our results improved as we went up in leverage and unfortunately, this also means up in RISK. However, if we apply our Algorithms to each of the 30 Dow stocks individually, we get our best percentage improvement at 93%. There must be a lesson somewhere.
My Mother was smart, and she said more work makes Johnny into a much smarter boy. I hope she knew nothing about the S&P500 or I am in for a lot more work.
UPDATED DOW RESULTS.
Chart E has been updated to use Friday close prices for all 30 stocks and a small error in the last 6 stocks corrected for trade quantities and days invested.
COMPLETE DOW RESULTS.
Finally completed results for the Dow Jones Industrial stocks and much of the information remains as previously reported. You will see a chart on the Blog now showing all Dow 30 stocks. So, what can we finally report?
First, if we were invested in the entire set of Algorithms, we would currently own 19 of the 30 and we would improve the past year of results by 93%.
Finally, we would have made 219 trades and be invested for an average of 160.4 days each or 64% of the time. Average cash would be 36% of invested capital.
One clever interpretation of this would be that if the cash were put to work in the average return of these Algorithms, then the return would be much higher.
We would ideally calculate that by the following formula: -
(36% divided by 64%) multiplied by 93%, giving us an additional 52% profit for the year. The total return for the year would then be 145% profit in THEORY.
Information is coming faster right now and there will be an additional post to the Blog on Monday. Thanks.
REALLY GOOD RESULTS SO FAR.
Hope to increase the information that I can report as the results are now becoming more evident as we proceed.
You will see a chart on the Blog today that shows our plain vanilla Algorithms working on the first 16 stocks belonging to the Dow 30 Industrials. They are in alphabetic order with no specific choice.
The exciting part of this to me, are the substantial results across the board, which leads me to be confident that we have more universal appeal. We can in the future put various types or combinations together.
Note that if you invested in these first 16 Dow stocks exactly 1 year ago, with equal amounts of money, you would now be up by 17.6% after 16 Buys.
However, if you had run the stocks through our New Algorithms during the exact same period, you would currently own 10 of them and you would have more than doubled your profit. This after just 100 total trades.
Here is the good stuff!
Not only that, but your money would be invested much more efficiently because you would have it invested for less of the time, making the cash portion available for increased investments, either in our Algorithms or some other choice.
Simply put, if we say that stocks go up 60% of the time and down the other 40% of the time, and you can be out when they are going down and in when they are going up, you achieve much better results.
A further look at the first straight purchase of all 16 stocks means that you would have lost money on 3 of them with the worst being General Electric at minus -51.1% and the best being Boeing at a positive 102%.
Our Algorithms eliminated all 3 losses and changed General Electric to almost 4% profit with the best still being Boeing at 114% profit.
Obviously, there are a multitude of choices just surrounding the Dow, but we are looking at other possibilities as well as single stocks, ETNs and ETFs. There are just as many choices when considering types of World Markets and types of Industries, either individually or as melded groups.
Please stay tuned as I fully intend to finish all the Dow 30 Industrials and make some choices available as soon as possible. We are committed to this project, especially now that we see so many alternatives in an amazing array before us. Thanks again for your interest.
THERE IS ALWAYS A BETTER WAY.
With seven years of focusing on the best way to improve my own investments, algorithms took second place to finding the VIX Volatility Index and XIV concept.
I must tell you that one week of failing results and having to think about the Credit Suisse deal, finally pointed me to successfully applying the Algorithms to tests elsewhere. And it worked!
In 1969, I used a Consultant to run a seminar on Functional Analysis, when I first heard the phrase � There is always a better way. I recognized it as part of my DNA and immediately adopted it.
Unfortunately, I do not do magic tricks, but I do have this DNA that does not quit, and I also still have over 6 years of Mathematical Algorithms and research.
I did some preliminary testing on a broad set of Exchange Traded Products and those results are shown in the small chart below.
The Top 10 includes Biotech, Semiconductors, China Stocks, Dow Stocks, Nasdaq Stocks, Crude Oil, Natural Gas, Silver, Oil Services and the S&P500 Stocks.
The Chart shows their Market returns for the past 12 months and finally, the Annual Return after processing them through the Algorithms.
My current thinking is an index or mixture that solves the issue of relying on a single issue such as XIV, which worked well for about 3 years before the recall. This is very early and will take more time to develop.
I will keep the Website and Blog going with the intention that negative and singular goals will be replaced by a balanced approach that will work, no matter the direction of the Markets or Economy.
Worth noting from the chart is that Gold and Silver and maybe Energy often become hedges against the Dow and S&P500. However, more importantly, Industries that lost money over the previous year were turned profitable after the Algorithms were applied.
I will send out occasional emails as significant changes occur and want to thank you for your interest in these Algorithms.
A HUGE DISAPPOINTMENT.
This has been a huge disappointment to you and to all of us and for it to happen in Extended Hours Trading is no solace.
XIV opened today at 10.49 and in three steps went to 5.50 and traded up to 8.69 and down to 7.35 at the close.
Credit Suisse was quick to issue an Event Acceleration per their Prospectus and we appear to be subject to XIV going below 20% of the Prior Day Closing Value.
Here is the Credit Suisse announcement again --> Credit Suisse Announcement
My apologies cannot change this bleak situation. Positions may be liquidated before the cash payment per ETN which appears to be after Feb 20th, 2018.
ALERT - Roebuck Systems Update
We have received several questions asking how yesterday's events have impacted XIV trading. We want to share an update on how we understand what is happening.
Credit Suisse announced the following this morning: --> Credit Suisse Announcement
It appears that no new shares will be issued and trading will end on Feb 20th. Trading in XIV has not currently opened. We will continue to update you with any new information regarding XIV and do our best to provide clarity on anything else that arises.
Malcolm and the Roebuck Systems team.
LATE EDITION
I am advising all followers not to buy any XIV until we can ascertain whether or not Credit Suisse or VelocityShares intends invoking their 20% value rule. During Extended Hours Trading tonight, XIV went as low as $10.00 per ETN which may or may not affect their 20% rule. We will try to find an answer to this and publish our findings as soon as we can.